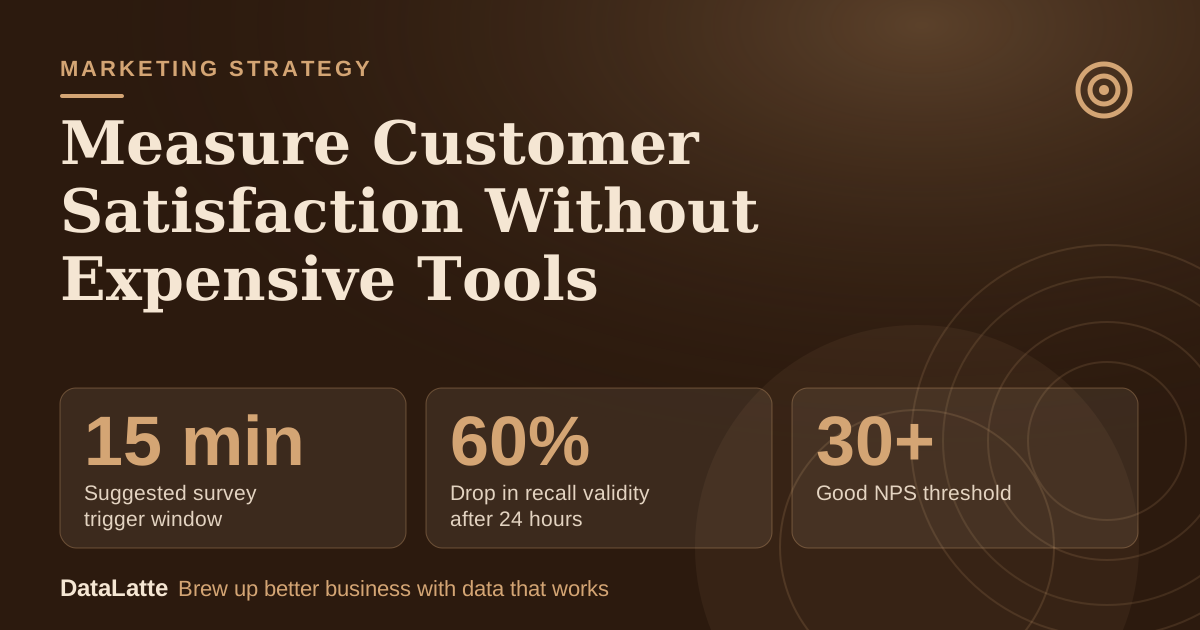
A small business can measure customer satisfaction with three low-cost tools: a one-question CSAT survey on a 1 to 10 scale, a one-question NPS survey on a 0 to 10 scale, and regular tracking of Google and Yelp reviews. Each one can run from a text message, an email or a spreadsheet. Sent within 15 minutes of a visit, the surveys catch opinions while the experience is still fresh.
→
Suggested survey trigger window
CustomerSure, cited by Adwave (secondary)
↑
Drop in recall validity after 24 hours
CustomerSure, cited by Adwave (secondary)
↓
Good NPS threshold
Listen360, 2026 (secondary)
→
Gym franchise median NPS
Listen360 Fitness NPS Benchmark Report, cited on its 2026 page (secondary)
See Sources at the end of the article. Cards marked Assumption are examples, not results.
How can a small business measure satisfaction without paid software?
Adwave's guide to measuring customer satisfaction without expensive tools (secondary) points to two kinds of measurement. Active measurement asks customers a short question. Passive measurement reads signals customers already leave behind, such as review velocity and sentiment on Google and Yelp.
Neither needs a dedicated platform at the start. A form, a text or email message and a spreadsheet are enough to collect scores and count reviews each week.
One framework is worth knowing about. CustomerSure, cited by Adwave (secondary), recommends a four-layer approach and claims it has a 35% higher correlation with actual revenue growth than single-metric tracking. That is a vendor claim, and the layers are not spelled out in the material reviewed here. The practical reading: pair one survey score with review tracking instead of relying on one number.
Once manual review counting becomes tedious, the
review management software comparison shows what paid tools add.
Which low-cost methods show what?
The table compares the methods. Effort and cost ratings are editorial assumptions, because the reviewed sources do not publish prices.
| Method | Effort (assumption) | Cost (assumption) | What it shows |
|---|
| CSAT, 1 to 10 scale | Low: one question | Free to low | How satisfied a customer was with one visit or service |
| NPS, 0 to 10 scale | Low: one question | Free to low | Likelihood to recommend, split into promoters, passives and detractors |
| Open comment question | Medium: replies must be read | Free | The reasons behind a score (editorial, not a sourced claim) |
| Review monitoring on Google and Yelp | Low per week, done by hand | Free | Review velocity and sentiment trend over time |
| Combined approach | Medium | Free to low | A broader picture than any single metric |
A survey score answers "how did this visit go?" Review monitoring answers "is the overall mood shifting?" Both questions matter, and they use different data.
How is a CSAT score calculated?
According to Adwave (secondary), CSAT can be calculated with a simple 1 to 10 scale: add the responses, divide by the total number of respondents, and turn the result into a percentage-based metric.
The page does not spell out the final conversion. One straightforward reading is to divide the average by the maximum score of 10. Under that reading, an average of 8.3 becomes 83%.
That conversion is an interpretation, not a sourced rule, so the choice matters less than staying consistent. Use the same question wording, the same scale and the same conversion every month. Changing any of the three makes month-to-month comparisons meaningless.
No CSAT benchmark appears in the reviewed sources. A business has to build its own baseline from its first few weeks of responses and compare against that.
How is NPS calculated?
The standard NPS question, per
Shopify (secondary), asks customers to rate on a scale of 0 to 10 how likely they are to recommend the company to a friend. Answers sort into three groups:
- Promoters answer 9 or 10.
- Passives answer 7 or 8.
- Detractors answer 6 or below.
The formula is the percentage of promoters minus the percentage of detractors. Shopify writes it as promoters divided by total respondents, minus detractors divided by total respondents, multiplied by 100. Passives count in the total but not in the subtraction.
Shopify's example: 100 people surveyed, 40 promoters, 50 passives and 10 detractors gives (40/100 - 10/100) x 100 = 30.
Listen360 (secondary) gives a second example. Of 200 respondents, 110 are promoters, 50 passives and 40 detractors, which yields 35. Scores range from -100 to +100. For more on running the survey, see the
NPS guide for small businesses.
What is a good NPS score for a local business?
Listen360's 2026 page (secondary) states that a good NPS is over 30. It cites SurveyMonkey data from over 150,000 organizations showing an average NPS of 32 and a median of 44. A score of 72 or above places a company in the top 25% globally, and 80 and above is described as world-class and very rarely achieved.
Industry matters. Listen360's 2026 table lists these ranges (lower quartile, median, upper quartile):
- Retail: 36, 57, 74
- Average across industries: 35, 57, 76
AskNicely (secondary) gives a retail and eCommerce benchmark of about 42, and the page shows no year. Two sources, two different retail figures. Benchmarks depend on who collected the data, so a score is best used against a business's own history first.
Spreads are wide as well. Listen360 notes that insurance runs from 36 to 86, a 50-point gap. Shopify makes the same point without numbers: scores vary considerably by industry.
For fitness, Listen360's Fitness NPS Benchmark Report, as cited on its page, puts the gym franchise median at 57, with 71 or higher in the top 25%. The page also calls the 88+ benchmark for boutique studio franchises notably high. No benchmark for salons, groomers or coffee shops appears in the reviewed material.
When should a satisfaction survey go out?
CustomerSure, cited by Adwave (secondary), says businesses should trigger feedback within 15 minutes of the interaction. The same source reports that surveys sent after 24 hours show a 60% drop in recall validity. Both figures come from a vendor, but the logic is simple: customers describe a visit more accurately right after it happens.
In practice, the trigger can be the checkout moment, the end of a class or the pickup of a pet. A text message link fits that window better than an email that arrives the next morning. The
SMS platform comparison covers tools that can send these messages automatically.
Keep the survey to one scored question, plus one optional comment box. A longer form lowers completion, and every extra question is another reason for a customer to abandon it. That last point is an editorial judgment, not a sourced finding.
Can review monitoring replace surveys?
Review monitoring supplements surveys but does not replace them. Feedback Robot, cited by Adwave (secondary), claims that passive measurement using review velocity and sentiment analysis on Google and Yelp can reach 92% accuracy in predicting churn when tracking a 30-day sentiment shift. That is a vendor claim, and the method behind it is not described in the material reviewed.
The same source gives a useful warning. Businesses focusing only on average rating can miss a 25% higher churn risk when review frequency drops by 40% while sentiment stays stable.
A simple weekly routine follows from this: count new reviews, note the star rating of each, and skim the text for repeated complaints. Keeping the profile itself in order helps too, and the
Google Business Profile checklist covers it.
What does a worked example look like for a fitness studio?
Every input below is an assumption chosen for illustration, not real client data.
Assumptions: a boutique fitness studio texts a link within 15 minutes of class ending. Over one month, 80 members answer the 0 to 10 recommend question. A separate 1 to 10 satisfaction question gets the same 80 responders.
NPS responses (assumption): 44 promoters, 24 passives, 12 detractors.
NPS = (44/80 - 12/80) x 100 = (55% - 15%) = 40.
CSAT responses (assumption): the 80 scores add up to 664. Dividing by 80 respondents gives 8.3, or 83% under the divide-by-10 reading above.
How to read it. A score of 40 clears Listen360's 2026 "good" line of over 30. It sits below the 57 gym franchise median from Listen360's fitness report. A single studio with 80 responses is not a franchise network, so the gap is a prompt for follow-up, not a verdict.
Review check (assumption): the studio received 20 Google reviews last month and 12 this month, a 40% drop in frequency. Per the Feedback Robot warning above, a steady star rating could hide that drop. The studio should look at who stopped posting and why.
The 12 detractors get a personal reply within a week. Lapsed members can feed a
reactivation campaign.
What is a 4-week plan to start measuring?
| Week | Tasks | Output |
|---|
| 1 | Choose one scored question (CSAT or NPS) and one comment question. Pick the channel (text or email). Create a spreadsheet with columns for date, score and comment. List the review sites to watch: Google and Yelp. | Survey draft and tracking sheet |
| 2 | Send the survey within 15 minutes of each visit. Record the current review count and star rating as a baseline. | First batch of responses and a review baseline |
| 3 | Read every comment. Contact detractors personally. Log the week's new reviews and their ratings. | Detractor follow-ups and a weekly review count |
| 4 | Calculate NPS or CSAT. Compare review frequency with the baseline. Choose one fix and one metric to watch next month. | First scorecard and a single action |
After week 4, repeat the same cycle with identical wording so that month two is comparable with month one. Compare the monthly score with the benchmarks only after a few cycles of history exist.
FAQ
What is a good CSAT score?
No CSAT benchmark appears in the reviewed sources, so a target is not documented. Adwave describes only how to calculate the score. Build a baseline from the first month of responses, then aim to improve on it.
How many survey responses are enough?
The reviewed sources set no minimum. Their examples use 100 and 200 respondents. With fewer responses, treat the result as a direction rather than a precise score, and watch whether the pattern repeats next month.
Should a business use NPS or CSAT?
The two answer different questions. CSAT rates satisfaction with a specific experience, while NPS asks about likelihood to recommend. CustomerSure's claim, cited by Adwave (secondary), favors a multi-layer approach over a single metric, so running both alongside review tracking is a reasonable setup.
Do star ratings alone show satisfaction?
Not reliably. Feedback Robot, cited by Adwave (secondary), warns that watching only the average rating can miss a 25% higher churn risk when review frequency falls by 40% and sentiment stays stable.
A free audit can show how satisfaction data fits into local campaigns:
request a free audit.
Sources