Net Promoter Score (NPS) is worth it for a small local business only as a cheap trend line. It is one question, a 0 to 10 scale, and a subtraction: the share of promoters minus the share of detractors. One vendor page calls a score over 30 good (
Listen360, secondary). With few responses and no local benchmark, the comments matter more than the number.
NPS rests on a single survey question. Shopify's guide words it as: "On a scale of 0 to 10, how likely are you to recommend us to a friend?" (
Shopify, secondary). HubSpot attributes the concept to Fred Reichheld of Bain & Company (
HubSpot, secondary).
Each answer places the customer in one of three groups:
- Promoters answer 9 or 10 and are described as enthusiastic advocates.
- Passives answer 7 or 8 and are described as mildly enthusiastic.
- Detractors answer 6 or below.
These groupings match across
Shopify,
HubSpot and
AdWave (all secondary).
For a coffee shop, salon, groomer or studio, the question works because it measures word of mouth, which is how most local businesses grow. It does not explain why a customer scored the way they did. A short follow-up question asking for the main reason is what turns the number into something actionable.
How is NPS calculated?
The formula is the percentage of promoters minus the percentage of detractors. Passives are excluded: "Passives (7s and 8s) don't factor into the calculation at all" (
Listen360, secondary). Shopify writes it as NPS = (promoters / total respondents − detractors / total respondents) x 100 (
Shopify, secondary).
The result always falls between −100 and +100. HubSpot notes that −100 means every respondent is a detractor and 100 means every respondent is a promoter (
HubSpot, secondary).
Listen360 gives a worked case: 200 people respond, with 110 promoters, 50 passives and 40 detractors. Promoters are 55% and detractors 20%, so the NPS is 35.
Shopify's own example uses 100 respondents (40 promoters, 50 passives, 10 detractors) and lands at 30. In both cases, a large passive group does nothing to raise or lower the score, which is why a business with many "pretty good" customers can still post a modest number.
What is a good NPS for a local business?
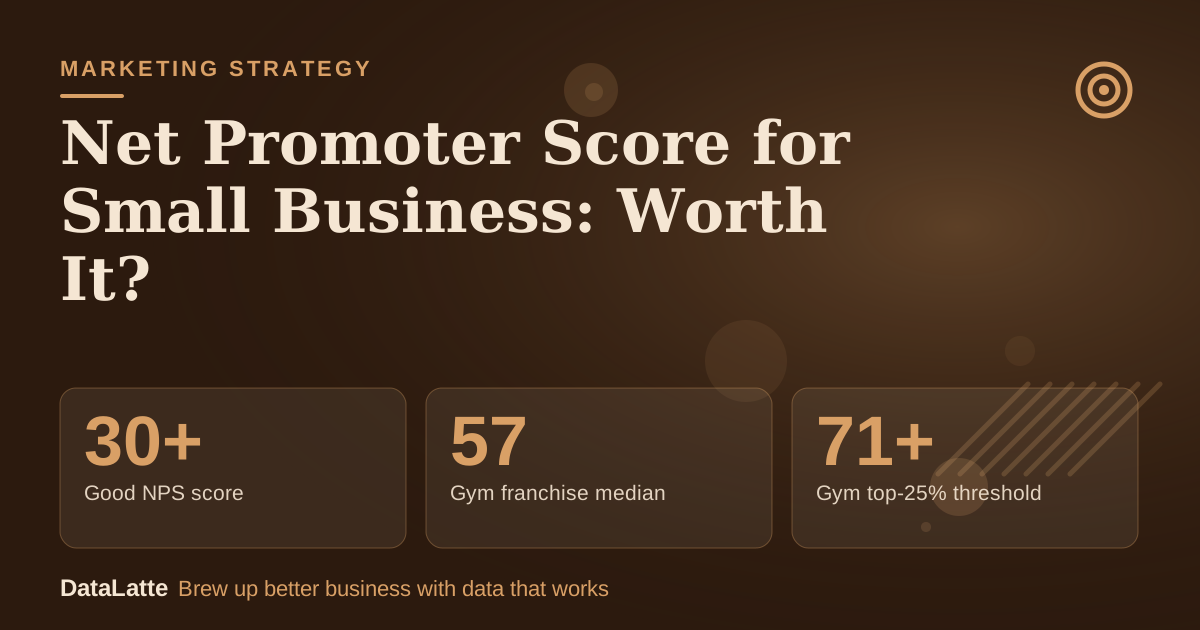
The general rule from one vendor is simple: "A good NPS score is over 30" (
Listen360, secondary). The same page cites SurveyMonkey data from over 150,000 organizations, with an average of 32 and a median of 44, and says 72 or above is the top 25% globally.
→
Good NPS score
Listen360 (secondary)
↑
Gym franchise median
Listen360 Fitness NPS Benchmark Report, as cited (secondary)
↓
Gym top-25% threshold
Listen360 Fitness NPS Benchmark Report, as cited (secondary)
→
Average vs median, all organizations
SurveyMonkey data as cited by Listen360 (secondary)
See Sources at the end of the article. Cards marked Assumption are examples, not results.
Fitness is the only local category with a figure in the sources. Listen360's fitness report, as cited, puts the gym franchise median at 57, with 71 or higher as the top 25%. The page also calls an 88+ benchmark for boutique fitness franchises "notably high."
No source here gives a benchmark for hair salons, beauty, pet grooming, coffee shops or restaurants. Treat any number quoted for those categories as unverified.
Nearby categories show how much the figures move:
- Listen360's 2026 table lists Retail at 36 (lower quartile), 57 (median) and 74 (upper quartile).
- AskNicely lists Retail and eCommerce at roughly 42 (AskNicely, secondary).
- HubSpot, citing Retently data for 2022-23, lists department and specialty stores at 59.
These sources are all vendors that sell survey software, so none is independent. The numbers also differ from one vendor to the next, and Retently-sourced hotel scores fell from 49 in 2022 to 29 in 2023. HubSpot's own advice is that any score above the average of a competitive set is theoretically good, which for a local shop means beating the shop down the street, not a global figure.
Why do small samples make NPS unreliable?
The sources give no guidance on minimum sample sizes, so this section is arithmetic, not a cited rule. With 20 responses, each single answer is 5% of the total. One customer moving from a 6 to a 7 shifts the detractor share by 5 points, and the score jumps by the same amount.
A 200-response survey like the Listen360 example absorbs that noise. A neighborhood business with 20 responses does not.
Three habits reduce the risk:
- Compare the score against the business's own previous rounds rather than a global benchmark.
- Report the raw counts (11 promoters, 5 passives, 4 detractors) next to the score.
- Read every written comment, since 20 comments are a usable amount of reading.
Industry spread is a second warning. Listen360 points out that insurance runs from 36 to 86, a 50-point spread. If a mature category has a range that wide, a single small shop landing 10 points above or below a "benchmark" says very little.
One way to see the effect is the example in the next section.
What does an NPS calculation look like with 20 responses?
This example is built for a hair salon. Every input is an assumption, not data from a real business.
Assumption: the salon texts a one-question survey to 20 clients after appointments in one month, and all 20 reply. Assumed results: 11 give a 9 or 10, 5 give a 7 or 8, and 4 give 0 to 6.
| Step | Calculation | Result |
|---|
| Promoter share | 11 / 20 | 55% |
| Passive share (not counted) | 5 / 20 | 25% |
| Detractor share | 4 / 20 | 20% |
| NPS | 55% − 20% | 35 |
The result of 35 sits above the 30 that Listen360 calls good, but that threshold is a general figure, not a salon benchmark.
Now test fragility. Assume two of the four detractors had answered 7 instead of 5. Detractors fall to 2 of 20, or 10%, and the score rises to 45. A 10-point swing from two answers shows why the raw counts and the four comments matter more than the headline number.
A sensible reading of the assumed results: the salon has a solid base of fans, and four unhappy clients to contact. The follow-up comments, such as wait times or a rushed color consultation, point to the next fix. A client list that already supports online booking also makes the follow-up text simple to automate (
online booking for salons).
None of the sources require paid survey software to ask the question. Any channel that reaches the customer right after the visit and lets them tap a number from 0 to 10 will work. A spreadsheet can hold the answers and apply the formula.
| Business type | Where to ask | Simple format | Low-cost route |
|---|
| Coffee shop | Receipt or counter card | QR code to a two-question form | Free form tool, answers into a spreadsheet |
| Hair or beauty salon | After checkout | Text message the same day | Existing booking or texting tool |
| Pet groomer | At pickup | Text to the pet owner | Manual text from the business phone |
| Fitness studio | After a class or at the front desk | Email or app prompt | Existing member email list |
The two questions are the 0 to 10 recommendation question and an open box asking for the main reason for the score. Anything longer lowers the response rate, though the sources give no figure for that, so this is a practical judgment.
If texting at volume is the plan, the
SMS platform comparison covers the options. Businesses that already run review requests can fold NPS into the same process through
review management software.
What does a 4-week NPS plan look like?
A first round does not need more than a month. The goal is a baseline, not a perfect score.
| Week | Task |
|---|
| Week 1 | Pick one channel from the table. Write the 0 to 10 question and one open-ended follow-up. Set up a spreadsheet with columns for date, score, group and comment. |
| Week 2 | Send the survey to every customer after their visit. Assumption: a target of 20 responses for a first read. Log each answer the same day. |
| Week 3 | Read every comment. Contact each detractor personally. Ask promoters to leave a public review, and check that the Google Business Profile is ready to receive it. |
| Week 4 | Calculate the NPS and record the raw counts. Choose one fix based on the comments. Schedule the next round for the same point in the month. |
Promoters are also the natural audience for referral offers or a
loyalty program. Lapsed detractors can feed a
reactivation campaign, though a personal apology usually comes first.
Does a higher NPS actually lead to growth?
Some vendor content says so. AdWave cites Ringly as saying NPS explains 20% to 60% of the variation in organic growth rates in most industries, that NPS leaders outgrow rivals by more than two times, and that companies with an NPS of 75 or higher see at least 13% higher customer lifetime value (
AdWave, secondary).
These are third-party claims retold by a marketing vendor, and the page does not show the underlying studies. They describe correlations across companies, not a promise that raising a salon's score from 35 to 45 will add revenue. The 75 threshold also sits above the 72 that Listen360 says marks the global top 25%.
The practical value for a small business is more modest. NPS gives a repeatable moment to ask customers how they feel, a list of unhappy customers to call, and a list of happy ones to invite to review. Where it sits in the wider customer journey is covered in the
local marketing funnel guide.
FAQ
Is NPS worth it for a very small business?
It is worth it as a low-cost habit if every response is read and acted on. As a precise score it is weak at small volumes, because each response moves the result substantially. Track raw counts and comments alongside the number.
What is a good NPS for a salon, groomer or coffee shop?
No source reviewed here gives a benchmark for salons, groomers, coffee shops or restaurants. The only local category with a figure is fitness: a gym franchise median of 57 and a top-25% threshold of 71 or higher, per Listen360's report as cited (secondary). A general rule from the same page is that over 30 is good.
Why do NPS benchmarks differ between websites?
Each vendor uses its own customer base, survey timing and industry groupings. For retail, one vendor lists a median of 57, another about 42, and a third 59 for department and specialty stores in 2022-23. All are survey-software companies, so none is independent. Use them as rough context and compare against the business's own past scores.
No. Customers who answer 7 or 8 are excluded from the calculation. They still count in the total number of respondents, so a large passive group dilutes both the promoter and detractor percentages.
How often should the survey run?
The sources do not set a schedule. A monthly round at a consistent point works for comparing results, since each round is a snapshot against the same conditions.
A free audit of local ad and review performance can show where customer feedback fits next to paid campaigns. Start with the
DataLatte free audit.
Sources