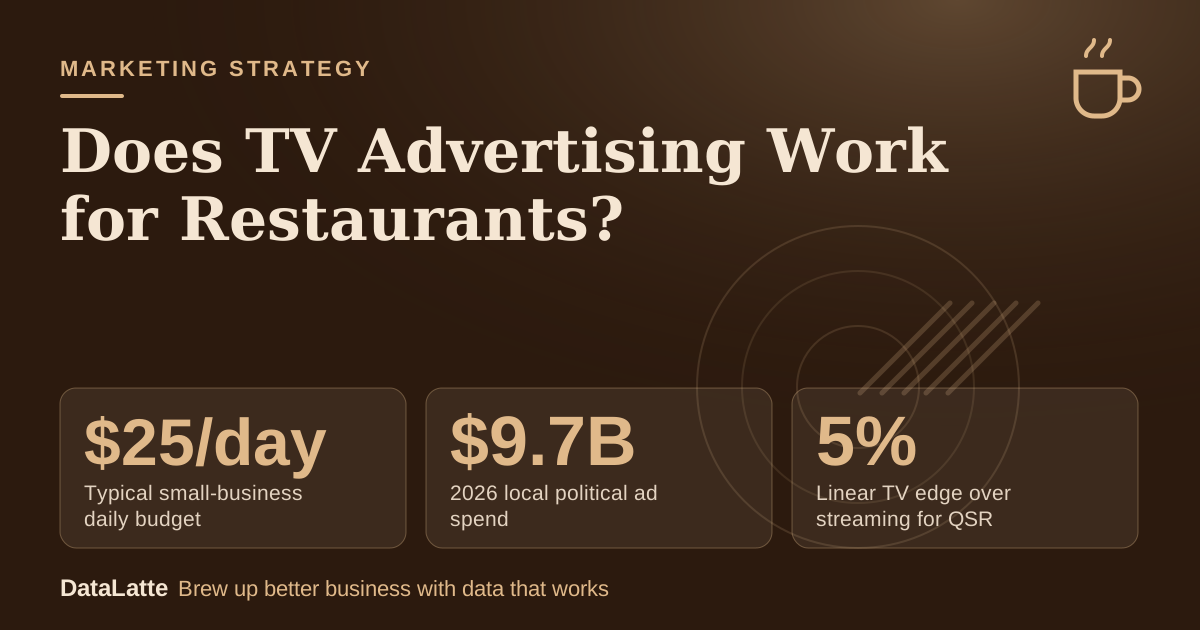
TV advertising can work for restaurants, but the available sources do not document a sales lift for independent restaurants. What they do show is that a test is cheap to run: streaming platforms report typical budgets of about $25 to $30 a day, and one source says linear TV was 5% more effective than streaming for quick-service chains in early 2024. The practical answer is to run a small, measured test before committing real money.
→
Typical small-business daily budget
Trusted TV, vendor data (secondary)
↑
2026 local political ad spend
BIA via Adwave, up from $8.4B in April (secondary)
↓
Linear TV edge over streaming for QSR
EDO via Adwave, Q1 2024 (secondary)
→
Restaurant revenue from repeat customers
Marketing LTB via Adwave (secondary)
See Sources at the end of the article. Cards marked Assumption are examples, not results.
What do the sources say about whether TV ads work for restaurants?
The evidence is thinner than the vendor marketing suggests. The most direct effectiveness figure comes from EDO research, which found that
linear TV ads were 5% more effective than streaming ads for QSR advertisers in Q1 2024 (secondary). That compares two formats for quick-service brands. It does not show what a single café or casual dining room should expect.
Scale matters too. The same page notes that the ten most-advertised restaurant chains spent a combined $3.8 billion on measured media in 2024. Chains with national budgets are a different case from a single-location owner testing a few hundred dollars.
Several demand-side facts explain why TV can still make sense. The page reports that 65% of restaurant revenue comes from repeat customers, that 88% of diners search online before choosing a restaurant, and that 91% look up menus before visiting (all secondary, Marketing LTB). A TV ad that gets someone searching is only useful if the listing, menu and order link are ready. The
Google Business Profile checklist covers that groundwork.
Casual dining is described as having a 1-2 week consideration window, which suggests a flight should run longer than a week.
Reported figures vary widely by format and market. The table lists what the sources state and marks gaps as "not stated."
| Format | Reported cost | Reported test size | Source |
|---|
| Local broadcast | $500 to $10,000 per month; a few hundred to several thousand dollars per airing | Not stated | National Media Spots, June 13, 2026 (secondary, via Adwave) |
| Regional cable | $1,000 to $20,000 per month | Not stated | National Media Spots, June 13, 2026 (secondary) |
| Streaming/CTV (market range) | $500 to $50,000+ per month; $15 to $40+ CPM | Launch on $500 to $1,000 a month | National Media Spots, June 13, 2026 (secondary) |
| Streaming (vendor: Adwave) | From $30 a day, prepaid, no contract | Daily budgets from $30 to $10,000 | Adwave (secondary) |
| Streaming (vendor: Trusted TV) | About $42.50 all-in CPM; about $25 a day | Roughly $700 over four weeks | Trusted TV (secondary) |
| TV 30-second spot (CPM) | $5 to $30 CPM | Not stated | Amazon Ads, date not stated (secondary) |
Production is a separate line for traditional spots. Moonb's 2026 guide puts a simple local spot at $1,500 to $10,000 and mid-range professional work at $10,000 to $50,000. Trusted TV states its pricing includes the video and campaign management.
For a fuller breakdown by market, see the
local TV advertising cost guide.
Is a $500 to $700 streaming test big enough to learn anything?
It is big enough to learn whether the mechanics work, but the reported delivery is small. Adwave states that a $500 two-week budget at a typical CTV CPM of $25
delivers approximately 20,000 impressions (secondary). Trusted TV reports that a typical four-week campaign at about $25 a day earns
roughly 9,100 views and reaches about 5,900 people (secondary).
Those numbers imply a small audience. A dense neighborhood restaurant may find 5,900 reached people meaningful. A suburban restaurant drawing from a wide area may not.
Geography is adjustable. Trusted TV reports that roughly 100% of its campaigns set their own geography and that the most common setting is a 10-mile radius around a ZIP code. A tighter radius concentrates the same budget on the households most likely to visit.
The sources do not say how many impressions or weeks produce a measurable sales change for a restaurant. Treat the first flight as a measurement exercise rather than a profit forecast. Frequency also matters when the audience is small, and the
ad frequency guide explains how to read it.
How can a restaurant measure TV and streaming results?
The sources do not describe a measurement method for restaurant TV, so the following are practical approaches rather than documented benchmarks. Each one creates a trail that survives the lack of a click.
Promo codes work when the offer is unique to the campaign. A spoken or on-screen code such as a named menu item or a phrase at the counter gives a count of redemptions, though it will undercount viewers who never mention it.
Order-ahead links work when the ad points to a dedicated URL or QR code. Tag the link so the visits appear separately in
Google Analytics 4. Branded search trends and calls can be tracked too, and
call tracking tools cover the phone side.
Geo tests compare matched areas. Run the ad in some ZIP codes and hold others back, then compare sales or orders before and after. Because platforms let advertisers set their own geography, this is feasible even on small budgets, though a small sample produces noisy results.
A broader walkthrough sits in the guide on
how to measure CTV ads for a local business. Record a baseline for at least the four weeks before launch so changes have something to be compared against.
What does a four-week test plan look like?
A four-week flight covers two of the 1-2 week consideration windows reported for casual dining. The plan below keeps one variable, the offer, constant so results stay readable.
| Week | Actions | What to record |
|---|
| 1 | Pick the target ZIP codes and a hold-out area. Create one campaign-only code and one tagged order-ahead link. Check that the menu and listing are current. Launch. | Baseline weekly sales and orders by area from the prior four weeks |
| 2 | Confirm delivery matches the plan. Review impressions and reach. Do not change the creative or the offer. | Impressions, reach, code redemptions, order-ahead visits |
| 3 | Repeat the week-2 review. Compare test and hold-out areas. Ask staff how many guests mentioned the ad. | Orders by area, branded searches, calls |
| 4 | Run to the end date. Calculate cost per coded order and the overall change versus baseline. Decide: repeat, adjust, or stop. | Total spend, total coded orders, total change versus baseline |
Dayparts deserve a question before launch. Adwave's marketing guide suggests
targeting residential zones during dinner hours of 5-8 pm and business districts around lunchtime of 11 am-2 pm (secondary) for geo-targeted ads. National Media Spots says prime time, typically 8 to 11 PM, carries the highest local TV rates. Ask any broadcast or cable seller which dayparts a quoted price covers.
What does a worked example look like for a coffee shop?
The inputs below are assumptions for a single-location coffee shop, with the budget and CPM borrowed from the reported typical figures. None of these are results.
| Input | Value | Status |
|---|
| Four-week streaming budget | $700 | Assumption, based on Trusted TV's typical figure |
| All-in CPM | $42.50 | Assumption, based on Trusted TV's reported average |
| Average ticket | $9 | Assumption |
| Contribution margin | 65% | Assumption |
| Visits per new customer over six months | 4 | Assumption |
The math runs in four steps:
- $700 divided by $42.50, times 1,000, gives about 16,470 impressions.
- Contribution per order is $9 times 65%, or $5.85.
- Break-even is $700 divided by $5.85, or about 120 incremental orders.
- At four visits per new customer, that is about 30 new customers over the four weeks.
The test then has a clear pass mark. If coded orders plus the measured lift in the test area against the hold-out area reach roughly 120 incremental orders, the flight breaks even under these assumptions. Falling short does not prove TV fails, since a single flight is small. It shows that this offer and area did not pay back in the first window.
The 65% repeat revenue figure is why the four-visit assumption is not unreasonable to test, though the actual number should come from the shop's own loyalty or POS data.
Does political ad spending change what restaurants pay for TV?
This is worth asking about, but the sources do not document an effect on restaurant pricing. BIA's September 2026 update puts 2026 local political spending at $9.7 billion, up from $8.4 billion in April, and says $1.2 billion of the $1.3 billion increase went to broadcast and streaming TV (secondary, via Adwave).
BIA's first look at 2027 has political spending falling to about $1.1 billion in the off-cycle year, with total local revenue roughly flat at $186.5 billion.
Those are spending totals, not rate cards. Nothing in the sources states that local TV or streaming prices for restaurants will rise or fall at any date. The sensible step is to ask each seller for current rates, the schedule they apply to, and any flexibility on start dates. Comparing two or three written quotes shows more than any forecast.
For restaurants weighing TV against search, the
CTV ads for restaurants and
Google Ads for restaurants guides cover the same budget decision from each side. Marketing LTB, as reported by Adwave, cites 6-12% of restaurant PPC clicks converting into reservations or orders and a typical marketing allocation of 2-6% of monthly revenue (both secondary). That is useful context when sizing a test.
FAQ
Is streaming TV or linear TV better for a restaurant?
One reported comparison favors linear: EDO found linear TV ads 5% more effective than streaming for QSR advertisers in Q1 2024 (secondary). Streaming has lower entry budgets and adjustable geography, so many small restaurants start there. The sources do not provide a head-to-head result for independent restaurants.
How much should a restaurant spend to test TV?
Sources report streaming launching on $500 to $1,000 a month, Adwave pricing from $30 a day and Trusted TV's typical $25 a day, about $700 over four weeks. Broadcast and cable are listed at $500 to $10,000 and $1,000 to $20,000 per month. Test sizes for broadcast are not stated.
How can I tell if a TV ad brought in customers?
Use a campaign-only promo code, a tagged order-ahead link and a hold-out area, and compare against a baseline from the previous four weeks. These methods are suggestions, since the sources do not document restaurant measurement results.
Will TV ad prices drop after the election cycle?
That is not documented in the sources. BIA's forecast covers political spending, not advertiser rates. Ask sellers for current quotes.
Sources
- How effective is TV advertising for restaurants? (Q4 2025), Adwave (secondary, vendor)
- The 2026 Small-Business Streaming TV Advertising Benchmark, Trusted TV (secondary, vendor)
- Local TV ad cost: broadcast, cable and streaming, Adwave (secondary, vendor, retelling National Media Spots, Amazon Ads, Moonb and BIA)
- 10 Game-Changing Restaurant Marketing Tips for 2026, Adwave (secondary, vendor)
A restaurant that wants a second opinion on whether search or TV should get the first test budget can request a
free marketing audit.
Free for local businesses
Want this applied to your business?
I'll review your Google presence, local SEO, and ad accounts — and send you a specific action plan within 48 hours. No pitch, no pressure.