What is RFM segmentation for a small business?
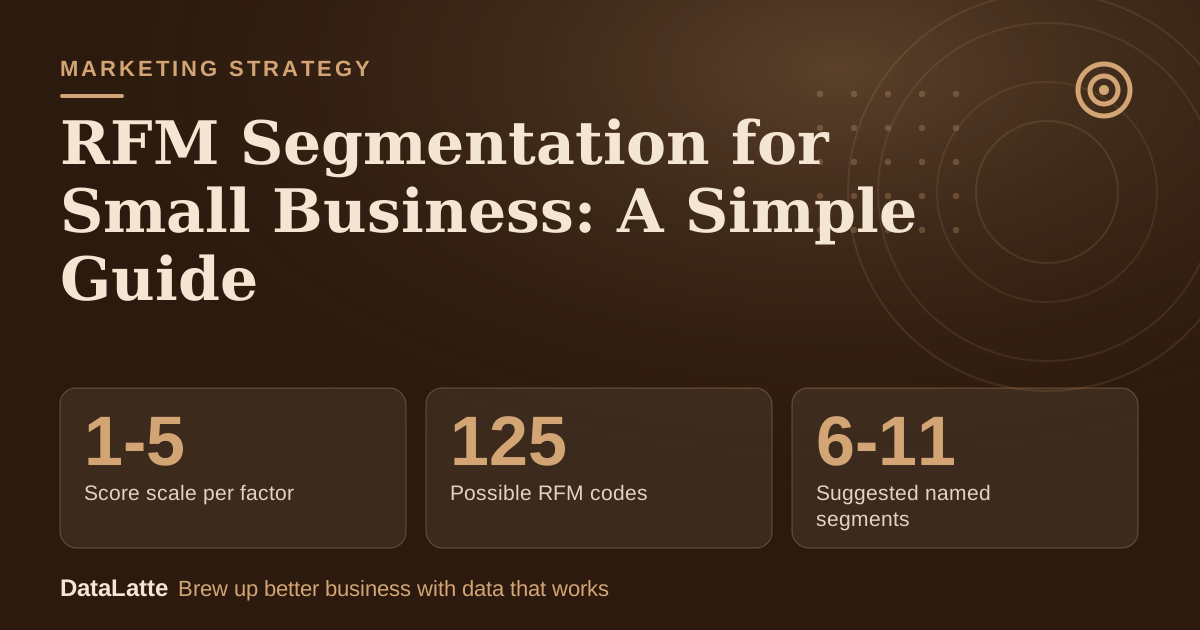
RFM segmentation sorts customers by how recently they bought (recency), how often they buy (frequency) and how much they spend (monetary). Each factor gets a score from 1 to 5, and the three digits form a code that places a customer in a named segment (
Rework, secondary). A local business with a customer list or booking history can run it in a spreadsheet.
→
Score scale per factor
Mailchimp (secondary)
↑
Possible RFM codes
Bloomreach via Rework (secondary)
↓
Suggested named segments
Rework (secondary)
→
Suggested data window
Bloomreach via Rework (secondary)
See Sources at the end of the article. Cards marked Assumption are examples, not results.
The method is old. One guide traces it to direct marketers mailing catalogs in the 1930s and 1940s, who kept a 3x5 index card for every customer (
Rejoiner, secondary). A spreadsheet replaces the cards.
The logic is simple. Customers who bought recently, typically within the last few weeks, still have the brand on their minds and are most likely to buy again (
Mailchimp, secondary). That makes the method a natural fit for businesses where customers return, such as salons, coffee shops, groomers and studios.
How are recency, frequency and monetary value scored?
Rejoiner defines recency as days since the last purchase, frequency as the sum of purchases over a customer's lifetime, and monetary value as the sum of revenue the customer has spent (
Rejoiner, secondary).
Two scoring approaches appear in the sources. The first ranks customers on each factor and splits each ranking into five equal groups, quintiles, where the top 20% score 5 (
Rework, secondary). Recency runs in the opposite direction: the most recent customers receive the highest score (
AdWave, secondary).
The second approach sets manual bands. Bloomreach suggests bands such as 1, 2, 3, 4 and 5 or more orders when frequency quantiles are uneven (
Rework, secondary). Most customers of a small shop have few visits, so manual bands are often easier to read.
Spreadsheet-ready scoring table for a salon. Every cutoff below is an assumption, not a standard. AdWave states that its scoring table is a pattern, not a universal set of calendar or spending cutoffs (
AdWave, secondary).
| Score | Recency: days since last visit (assumption) | Frequency: visits in 12 months (assumption) | Monetary: spend in 12 months (assumption) |
|---|
| 5 | 0-30 | 5 or more | $600 or more |
| 4 | 31-60 | 4 | $400-$599 |
| 3 | 61-90 | 3 | $250-$399 |
| 2 | 91-180 | 2 | $120-$249 |
| 1 | 181 or more | 1 | Under $120 |
A recency formula for the sheet, with the last visit date in column B:
Recency days:  =TODAY()-B2
Recency score: =IFS(C2<=30,5,C2<=60,4,C2<=90,3,C2<=180,2,TRUE,1)
What customer data does a local business need?
Four columns are enough: a customer ID or name, the date of the last visit or purchase, the number of visits, and total spend. Booking software, a point-of-sale export or a loyalty platform usually holds all four. The
online booking system guide for salons covers where booking histories live.
Bloomreach recommends 12 to 24 months or more of purchase data for RFM analysis (
Rework, secondary). The sources do not set a minimum customer count. AdWave says a modest dataset can support structured scoring, often on a 1 to 5 scale (
AdWave, secondary).
One caveat applies to the method itself. Mailchimp's example is a car company that might sell a single car to an individual within ten years, which shows that frequency says little when customers rarely buy (
Mailchimp, secondary). Repeat-visit businesses do not have that problem.
Before scoring, merge duplicate customer rows and remove staff or test entries. A duplicate splits one person's visits across two rows and lowers both frequency scores.
How does scoring work step by step with 20 customers?
The example below is a salon with 20 customers. All inputs, bands and segment rules are assumptions for illustration, not benchmarks.
Step 1. Apply the bands from the scoring table. Step 2. Join the three scores into a code, recency first. Step 3. Assign each customer to the first matching rule in this assumed order:
- VIP: R, F and M all 4 or higher.
- New: F is 1 and R is 4 or higher.
- Loyal: R is 3 or higher and F is 3 or higher.
- Lapsed: R is 1.
- At risk: R is 2.
- Everyone else stays on the regular newsletter.
| ID | Days since visit (assumption) | Visits, 12 mo (assumption) | Spend (assumption) | R | F | M | Code | Segment |
|---|
| C1 | 12 | 8 | $720 | 5 | 5 | 5 | 555 | VIP |
| C2 | 25 | 6 | $610 | 5 | 5 | 5 | 555 | VIP |
| C3 | 40 | 5 | $480 | 4 | 5 | 4 | 454 | VIP |
| C4 | 18 | 4 | $410 | 5 | 4 | 4 | 544 | VIP |
| C5 | 55 | 4 | $350 | 4 | 4 | 3 | 443 | Loyal |
| C6 | 70 | 3 | $300 | 3 | 3 | 3 | 333 | Loyal |
| C7 | 28 | 1 | $85 | 5 | 1 | 1 | 511 | New |
| C8 | 9 | 1 | $140 | 5 | 1 | 2 | 512 | New |
| C9 | 85 | 3 | $270 | 3 | 3 | 3 | 333 | Loyal |
| C10 | 110 | 5 | $520 | 2 | 5 | 4 | 254 | At risk |
| C11 | 130 | 4 | $430 | 2 | 4 | 4 | 244 | At risk |
| C12 | 150 | 3 | $330 | 2 | 3 | 3 | 233 | At risk |
| C13 | 95 | 2 | $190 | 2 | 2 | 2 | 222 | At risk |
| C14 | 200 | 2 | $160 | 1 | 2 | 2 | 122 | Lapsed |
| C15 | 240 | 1 | $70 | 1 | 1 | 1 | 111 | Lapsed |
| C16 | 300 | 1 | $95 | 1 | 1 | 1 | 111 | Lapsed |
| C17 | 320 | 3 | $310 | 1 | 3 | 3 | 133 | Lapsed |
| C18 | 65 | 2 | $210 | 3 | 2 | 2 | 322 | Regular list |
| C19 | 45 | 2 | $175 | 4 | 2 | 2 | 422 | Regular list |
| C20 | 220 | 6 | $640 | 1 | 5 | 5 | 155 | Lapsed |
Summing the spend column gives the totals below (assumption).
| Segment | Customers | 12-month spend |
|---|
| VIP | 4 | $2,220 |
| Loyal | 3 | $920 |
| New | 2 | $225 |
| At risk | 4 | $1,470 |
| Lapsed | 5 | $1,275 |
| Regular list | 2 | $385 |
In this example, at-risk and lapsed customers are 9 of 20 customers and $2,745 of the $6,495 total, about 42%. C20 is the clearest case: a 155 code means a high-frequency, high-spend customer who has not visited in 220 days.
In the sources' notation, 555 is the most recent, most frequent and highest-spending customer, and 111 is the opposite, probably not worth marketing to (
Rejoiner, secondary).
Which segments fit a small business, and what offer suits each?
A grid of 125 codes is unusable for a shop owner. The recommendation in the sources is to group the codes into 6 to 11 named segments, each defined by a rule on the three scores (
Rework, secondary). Oracle's model uses 6 personas assigned from recency and frequency alone, and Putler lists 11 segments (same source). Five segments plus a default list is a workable start.
The offers below are ideas to test, not proven tactics. Rules are the assumed ones from the salon example.
| Segment | Rule (assumption) | Salon | Coffee shop | Pet groomer | Fitness studio |
|---|
| VIP | R, F, M all 4+ | Early access to holiday slots | Preview of the seasonal menu | Priority holiday appointments | Invite to a member-only workshop |
| Loyal | R 3+, F 3+ | Rebooking reminder at their usual interval | Bonus stamp week | Pre-book the next visit at checkout | Referral invite for a friend |
| New | F 1, R 4+ | Thank-you note with a rebook link | Second-visit treat | Care-tips message with a rebook link | Welcome check-in and class suggestion |
| At risk | R 2 | "Time for your next appointment" with open slots | Bring-a-friend offer | Seasonal coat-care reminder | Guest pass or personal check-in |
| Lapsed | R 1 | One win-back offer, then stop | One comeback drink | Comeback add-on service | Trial week to return |
Reactivation messaging is covered in the
customer reactivation campaigns guide. A
loyalty program can store the visit counts that feed frequency.
What does a 2-week RFM plan look like?
The plan below assumes one owner or manager working a few hours across the two weeks.
Week 1: build the scores
- Day 1-2: export 12 to 24 months of customer, date, visit-count and spend data.
- Day 3: merge duplicates and delete test or staff rows.
- Day 4: look at the spread of each column and set bands from the shop's own data. Use manual frequency bands if most customers sit at 1 or 2 visits.
- Day 5: add the score formulas and the three-digit code column.
- Day 6-7: apply segment rules in order, count customers per segment and check that no segment is empty or holds most of the list.
Week 2: act and check
- Day 8: write one short message per segment, using the table above.
- Day 9-10: send by email or text. The SMS platform comparison and the email campaign ideas help with tooling and copy.
- Day 11-12: log replies, bookings and visits by segment.
- Day 13: compare segments and drop any message that drew nothing.
- Day 14: save the bands and set a re-score date.
The
marketing automation guide for hair salons shows how to turn the sends into triggered messages later.
What small-business caveats apply to RFM?
Thresholds belong to the business. AdWave says its quantile-based table is a scoring pattern, not a universal set of cutoffs (
AdWave, secondary). A coffee shop that sees customers weekly and a groomer that sees them every eight weeks need different recency bands.
Thresholds also age. Bloomreach says fixed thresholds may need monthly readjustment (
Rework, secondary). A new calendar-based reminder keeps bands honest.
Keep segments few. Quintiles on a list of 20 put 4 people in each group, and ties on visit counts make the groups uneven. That is why manual bands and a short segment list suit small customer files better than a full 125-cell grid.
Scores describe past behavior only. They do not explain why a customer left, so a low score is a prompt for a message, not a verdict.
FAQ
How many customers are needed to use RFM?
The sources set no minimum. AdWave says a modest dataset can support structured scoring, often on a 1 to 5 scale (
AdWave, secondary). Bloomreach advises 12 to 24 months or more of purchase data (
Rework, secondary).
Should scoring use quintiles or fixed bands?
Quintiles split each factor into five equal groups, with the top 20% scoring 5. Bloomreach suggests manual bands when frequency quantiles are uneven (
Rework, secondary). Small customer files with many one-visit customers often fit manual bands better.
How many segments should a small business use?
Rework recommends grouping the 125 codes into 6 to 11 segments. Oracle's model uses 6 personas from recency and frequency alone (
Rework, secondary). Five named segments plus a default list fall at the low end of that range.
What do the scores 555 and 111 mean?
A 555 customer is the most recent, most frequent and highest-spending. A 111 customer is the opposite and probably not worth marketing to (
Rejoiner, secondary).
For help turning segments into booked appointments, request a
free marketing audit.
Sources
- What Is RFM? Definition, Purpose, and Examples, Mailchimp (secondary)
- RFM Segmentation Small Business Guide, AdWave (secondary)
- RFM Analysis: Recency, Frequency, Monetary Segmentation Explained, Rework (secondary; retells Braze, Bloomreach, Putler and Oracle)
- RFM Analysis: The Ultimate Guide to Ranking Customer Value, Rejoiner (secondary)
Free for local businesses
Want this applied to your business?
I'll review your Google presence, local SEO, and ad accounts — and send you a specific action plan within 48 hours. No pitch, no pressure.