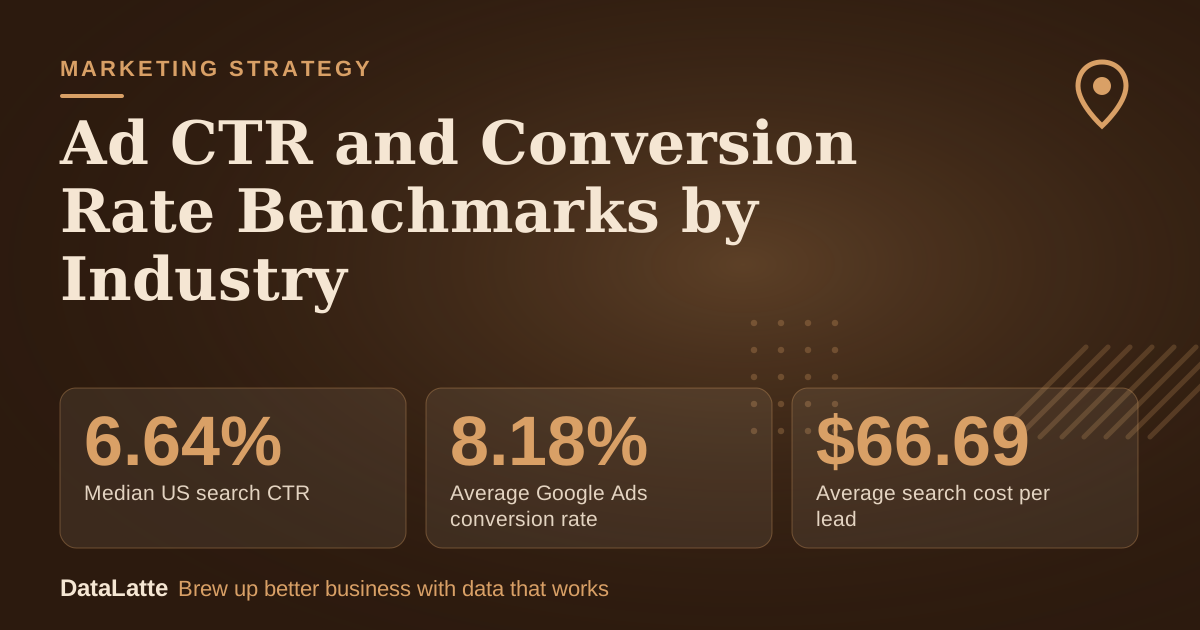
The 2026 search benchmark from WordStream and LocaliQ puts the median US search ad click-through rate (CTR) at
6.64% (secondary), and the average Google Ads conversion rate across industries at 8.18% in the same LocaliQ data. Industry figures spread widely, from 12.75% CTR for Arts & Entertainment to 5.87% for Attorneys & Legal Services. No source below lists salons, fitness studios or coffee shops as their own category, so these numbers are reference ranges, not targets.
→
Median US search CTR
WordStream and LocaliQ 2026 (secondary)
↑
Average Google Ads conversion rate
LocaliQ 2026; older WordStream data shows 3.75% (secondary)
↓
Average search cost per lead
LocaliQ 2026; fell overall for the first time in five years (secondary)
→
Average Facebook ad CTR
Focus Digital 2026, all objectives (secondary)
See Sources at the end of the article. Cards marked Assumption are examples, not results.
What CTR and conversion rates do the sources report by industry?
The table below lists only figures stated in the sources. Where a source gives nothing for a cell, it says "not stated" rather than a guess. All search figures come from the 2026 WordStream and LocaliQ benchmark data, covering Google Ads and Microsoft Ads.
| Industry | Search CTR | Average CPC | Conversion rate |
|---|
| All industries | 6.64% | $5.42 | 8.18% |
| Arts & Entertainment | 12.75% | $1.63 | not stated |
| Animals & Pets | 7.49% | $4.06 | 16.22% |
| Apparel / Fashion & Jewelry | 6.64% | $4.44 | 4.50% |
| Attorneys & Legal Services | 5.87% | $9.87 | 5.55% |
| Finance & Insurance | 9.83% | not stated | not stated |
| Travel | 9.32% | not stated | not stated |
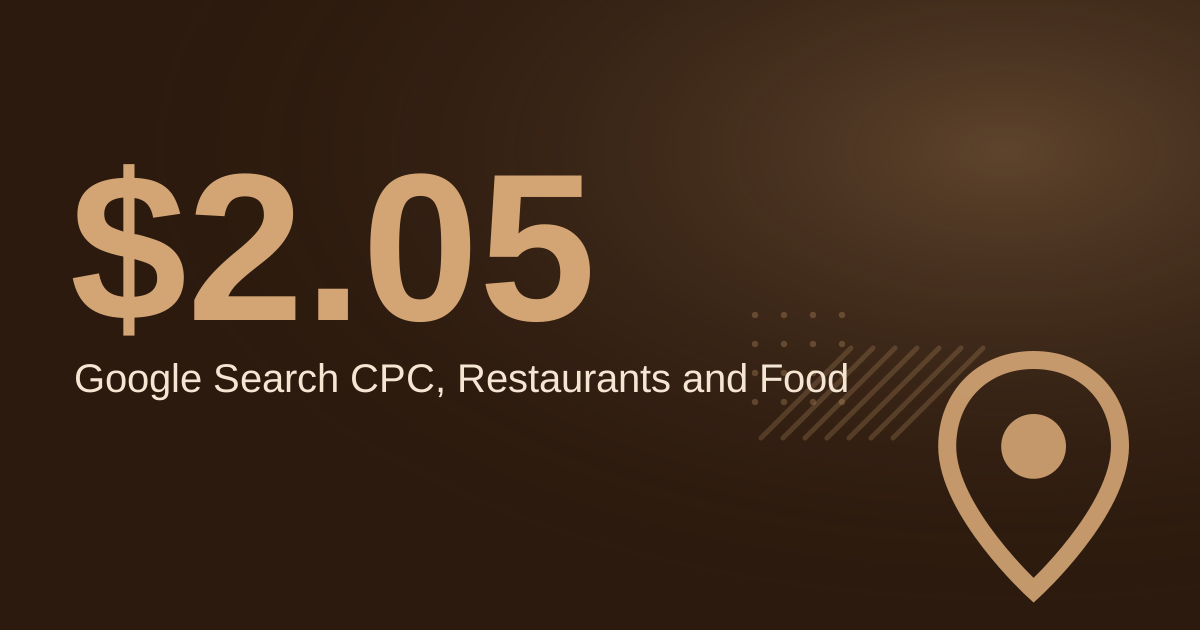
| Restaurants & Food | not stated | $2.05 | not stated |
| Hair and beauty salons | not stated | not stated | not stated |
| Fitness studios | not stated | not stated | not stated |
CTR and CPC figures come from
LocaliQ's 2026 search benchmarks (secondary) and from a table by Digital Applied summarized on
AdWave (secondary). Conversion rates come from LocaliQ. Whether Animals & Pets includes groomers is not stated.
Why do the benchmark sources conflict?
Benchmarks from different years and datasets rarely agree. An older
WordStream industry page (secondary) reports an average Google Ads search CTR of 3.17% and a search conversion rate of 3.75%. The 2026 data shows 6.64% and 8.18%. The cost per click moved too: $2.69 for search then, $5.42 now.
Industry rankings shifted as well. WordStream reported legal services at a 1.35% average CTR when first collected in 2015. The 2026 figure for Attorneys & Legal Services is 5.87%. Legal search conversion was 6.98% on the older page and is 5.55% in 2026, so the direction is not the same for every metric.
The sources do not explain these gaps. One documented difference is definition: LocaliQ calculates conversion rate as leads divided by clicks, and counts a lead as a phone call, chat, form fill or email. The older page's definition is not stated here.
Wording also varies. AdWave calls 6.64% a median, while LocaliQ calls it an average. Display CTR is one place where sources agree: 0.46% on the older WordStream page and 0.46% in Focus Digital's February to December 2025 display study.
What do social, display and email benchmarks show?
Search is not the only channel with published numbers, but the figures sit on a different scale.
Focus Digital's 2026 study (secondary), as summarized by AdWave, averages across all campaign objectives:
- Facebook: 0.90%
- Instagram: 0.68%
- X: 0.86%
- TikTok: 0.61%
- LinkedIn: 0.52%
Objective matters. In the same study, Facebook traffic campaigns average 1.93% and lead campaigns 2.70%. A 0.90% Facebook CTR is therefore not a failing grade for search-style expectations, and 6.64% is not a fair bar for a social ad. The sources do not discuss why the channels differ, so comparisons should stay inside one channel and one objective.
Email carries its own benchmarks.
Mailchimp's data (secondary), last updated December 2023, lists an all-users unique open rate of 35.63% and an optimal email CTR of 2.66 percent. The same page also suggests aiming for about 34.23 percent open rate, a small internal mismatch that shows how soft these targets are. Ideas for campaigns are in
20 email campaigns that drive revenue.
Why do local businesses differ from the averages?
The sources do not measure local businesses separately, so the honest answer is partial. Three limits are visible in the data.
First, category fit. A salon or fitness studio has no row of its own, and the nearest labels may not match. The older WordStream page lists Consumer Services among the lowest-CTR industries as of 2018, with an average CPC of $6.40. Whether a salon sits in that group is not stated.
Second, ranges are wide even among listed categories. Animals & Pets converts at 16.22% while Apparel / Fashion & Jewelry converts at 4.50%. The all-industries 8.18% describes neither.
Third, volume. This point is arithmetic, not a sourced claim: on 200 clicks, one extra booking moves conversion rate by 0.5 points. Small accounts swing more month to month. Mailchimp's industry benchmarks also only included campaigns sent to at least 1,000 subscribers, so a very small list falls outside the data.
How should a benchmark be used?
A benchmark answers one question: is a number in a plausible range? It does not say what the number should be. Chasing an average can push an account toward a goal that has nothing to do with profit.
A more useful routine has three parts.
- Record the account's own CTR, conversion rate and cost per lead for the last full period. That baseline is the main comparison.
- Use the same definition of conversion as the benchmark when comparing. Under LocaliQ's definition, phone calls, chats, forms and emails all count, so tracking only form fills understates the rate. Tracking setup is covered in Google Analytics 4 for small business.
- Read the cost per lead alongside the rates. LocaliQ's 2026 average is $66.69 across industries, and the answer to "is that fine?" depends on what a new client is worth to the shop.
Rates that improve while cost per lead rises, or the reverse, point to different problems.
What should be done when CTR is below the range?
A CTR under the 6.64% median is a prompt to check, not a verdict. Industry figures run from 5.87% to 12.75% in the table, so the right comparison group matters first.
A short diagnostic order helps:
- Confirm the benchmark matches the channel. A search CTR compared with a social CTR will always look poor.
- Review which search terms triggered the ads. Clicks and impressions from loosely related queries pull CTR down.
- Check that the ad text names the service and the neighborhood, and that the offer is specific.
- Check the business listing that sits beside the ad. The steps are in the Google Business Profile checklist.
- Change one element at a time, so the result can be traced.
Low CTR alone does not mean the account loses money. The worked example below shows a 4.0% CTR with a cost per lead below the LocaliQ average. If CTR is fine but bookings are weak, the problem is further along, usually the landing page. See
website conversion rate optimization.
What does a worked example look like for a salon?
Every input below is an assumption for illustration, not a measured result. A salon runs search ads for one month.
- Budget: $600 (assumption)
- Impressions: 5,000 (assumption)
- Clicks: 200, so CTR is 4.0% (assumption)
- Average cost per click: $3.00 (assumption)
- Booking requests by call, form or chat: 10, so conversion rate is 5.0% (assumption)
Against the 2026 figures, CTR sits below the 6.64% median and conversion below the 8.18% average. Cost per lead is $60, below LocaliQ's $66.69. No salon-specific benchmark is stated, so this is a rough read only.
| Scenario (all assumptions) | Impressions | Clicks | Spend | Requests | Cost per request |
|---|
| Baseline | 5,000 | 200 | $600 | 10 | $60.00 |
| CTR rises to 5.0%, same CPC and conversion | 5,000 | 250 | $750 | 12.5 average | $60.00 |
| Conversion rises to 7.0%, same clicks | 5,000 | 200 | $600 | 14 | $42.86 |
A higher CTR brings more bookings but also more spend, so cost per request stays flat. A better conversion rate lowers the cost per request at the same budget. For this salon, the booking path is the first fix, starting with an
online booking system.
What does a 4-week check-and-improve plan look like?
The plan uses one change at a time, so results stay readable.
- Week 1, baseline: export the last full period's impressions, clicks, CTR, spend, conversions and cost per lead. Write down what counts as a conversion (call, chat, form or email) and confirm each is tracked.
- Week 2, compare and diagnose: place each metric next to the nearest benchmark row, noting that no salon, fitness or coffee shop row exists. Review search terms and the ad text. Pick the one metric furthest from the account's own baseline or the range.
- Week 3, change one thing: rewrite the ad text, tighten keywords, or simplify the booking page, depending on the Week 2 finding. Leave everything else alone.
- Week 4, read and decide: compare CTR, conversion rate and cost per lead with the Week 1 baseline. Check whether click volume is large enough to trust the change. Keep, revert or test the next single change.
Repeat monthly. Check conversion tracking in Week 1 each cycle, since a broken tag looks like a collapse in conversion rate.
FAQ
What is a good CTR for a local business search ad?
No source gives a figure for local businesses as a group. The 2026 median for US search ads is 6.64%, and listed industries range from 5.87% (Attorneys & Legal Services) to 12.75% (Arts & Entertainment). The more reliable yardstick is the account's own trend over several months.
What is a good conversion rate for Google Ads?
LocaliQ's 2026 average across industries is 8.18%, with Animals & Pets at 16.22%, Attorneys & Legal Services at 5.55% and Apparel / Fashion & Jewelry at 4.50%. LocaliQ defines it as leads divided by clicks, so calls and chats count. Salon and fitness figures are not stated.
The older WordStream page shows a 3.17% search CTR and 3.75% conversion rate, against 6.64% and 8.18% in 2026. The sources do not explain the gap. Different years, datasets and definitions may all contribute, so mixing figures from both sets in one comparison is not advised.
Can a Facebook CTR be compared with a search CTR?
The sources do not support that comparison. Focus Digital's 2026 study averages 0.90% on Facebook, with traffic campaigns at 1.93% and lead campaigns at 2.70%, while search medians sit at 6.64%. Compare within one channel and one campaign objective.
Sources
- AdWave: Click-through rate by industry (secondary; summarizes WordStream and LocaliQ 2026, Digital Applied and Focus Digital)
- WordStream: Google Ads benchmarks for your industry (secondary; older vendor data)
- LocaliQ: 2026 search advertising benchmarks (secondary; vendor data)
- Mailchimp: Email marketing benchmarks (secondary; vendor data, last updated December 2023)
To see how an account's CTR and conversion rate compare with its own baseline, request a
free audit.
Free for local businesses
Want this applied to your business?
I'll review your Google presence, local SEO, and ad accounts — and send you a specific action plan within 48 hours. No pitch, no pressure.