DataLatte☕
Marketing Strategy

Customer Journey Mapping for Small Business: A Guide
Infographic: Customer Journey Mapping for Small Business: A Guide
November 12, 2026·Nataliia Rumiantsewa· 9 min read All posts

What is customer journey mapping for a small business?

Customer journey mapping for a small business is a one-page record of the steps a customer takes with the shop, from first hearing about it to coming back or recommending it. Each step lists the touchpoints (where the customer meets the business), the friction (where they get stuck) and one number showing whether the step works. The U.S. Chamber of Commerce defines a map as "a visual representation of the ways a customer interacts with your brand before and after they make a purchase."
The "after" half is the part local businesses tend to skip. AdWave's small-business guide cites Gladly's research that 61% of small businesses receive more than half their revenue from repeat customers (AdWave, secondary). A map that ends at the first sale leaves out the stage that may carry most of the revenue.
The Chamber also notes that a customer journey is "similar to a sales funnel." The two views overlap, and the local marketing funnel guide covers the funnel side.
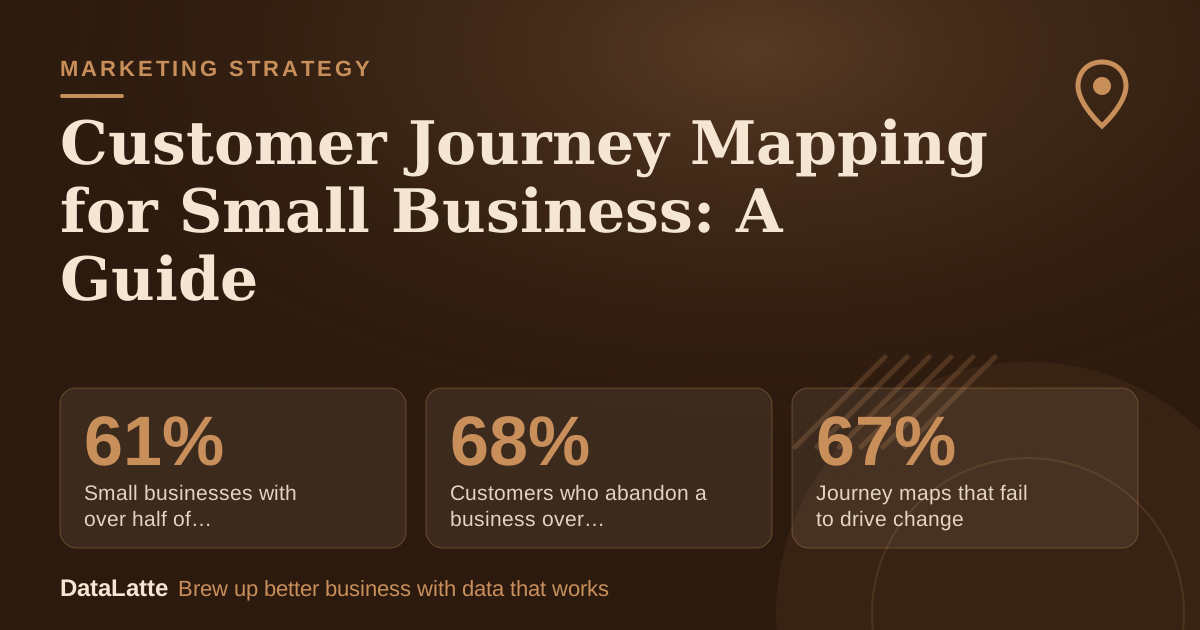
61%→

Small businesses with over half of revenue from repeat customers

Gladly via AdWave (secondary)

68%↑

Customers who abandon a business over perceived indifference

Opiniator via AdWave (secondary)

67%↓

Journey maps that fail to drive change

Harvard Business School Online via AdWave (secondary)

3 to 5→

Stages used across the sources

Chamber: 3, PayJunction: 4, Smith.ai and myPOS: 5

See Sources at the end of the article. Cards marked Assumption are examples, not results.

How many stages should a local journey map use?

The sources do not agree on stage names or on how many stages exist. The U.S. Chamber says there are three broad stages: before purchase, purchase and usage, and after purchase. Smith.ai and myPOS both list five: awareness, consideration, purchase, retention and advocacy (myPOS, secondary).
A 2017 PayJunction article (secondary) uses four, moving from awareness to engagement, then transaction, then retention.
The differences are mostly labels. Every version starts with discovery and continues past the sale. The Chamber adds that most maps start with the awareness phase, when someone discovers the company.
For a local shop, the five-stage version is the easier one to act on, because "come back" and "recommend" are separate problems with separate fixes. That is a judgment call, not a rule from the sources. The important part is to pick one model and keep the names fixed for the whole project.
Plain-language definitions help staff stay consistent:
  • Awareness: the person learns the business exists. PayJunction lists advertising, cold calls, email blasts or other marketing vehicles as ways this happens.
  • Consideration: the person compares options and checks reviews, photos and prices.
  • Purchase: the person books, orders or signs up. myPOS says this decision typically weighs price, service quality and the ease of the checkout process.
  • Retention and advocacy: the customer returns, then recommends.

Which touchpoints and metrics fit a salon, coffee shop, groomer or studio?

Touchpoints differ by business, but the structure stays the same: one or two touchpoints per stage and one metric the business can already count. The table below is an illustrative example, not data and not a benchmark. Replace each cell with what the business actually uses.
StageSalon (example)Coffee shop (example)Pet groomer (example)Fitness studio (example)
AwarenessMaps listing, Instagram. Metric: listing viewsMaps search, street sign. Metric: direction requestsNeighbor referral, Maps. Metric: calls from listingLocal search, social. Metric: trial-offer page visits
ConsiderationPhotos, reviews. Metric: booking-page visitsMenu photos, hours. Metric: listing clicksReviews, price page. Metric: quote requestsClass schedule. Metric: trial sign-ups started
PurchaseOnline booking page. Metric: completed bookingsCounter or mobile order. Metric: orders per dayPhone or web form. Metric: booked appointmentsSign-up form. Metric: trials started
RetentionRebooking prompt. Metric: rebook rateLoyalty card. Metric: second visit within 14 daysReminder text. Metric: rebook rateWeek-one check-in. Metric: attendance in first 30 days
AdvocacyReview request. Metric: new reviews per monthPhoto tags, reviews. Metric: reviews per monthReferral card. Metric: referrals redeemedBring-a-friend pass. Metric: friend sign-ups
Awareness and consideration metrics usually live in the listing dashboard, so a tuned profile gives cleaner numbers. The Google Business Profile checklist covers that setup.

How can friction points be found without a research budget?

The Chamber lists surveys, focus groups and online reviews as ways to learn how customers experience a business. For a small shop, reviews are the cheapest of the three. Reading recent reviews and tagging each complaint with a journey stage shows where problems cluster. A review management comparison helps when reviews arrive from several sites.
A second method is walking the journey as a new customer: search the business name on a phone, open the listing, try to book or order, and note every moment of doubt or delay.
Phone calls deserve a separate check. Smith.ai, which sells answering services, states that sixty-seven percent of customers prefer speaking to a live person for important purchases, but the page gives no source for that figure (Smith.ai, secondary). Treat it as a prompt to test, not as a fact. Call tracking shows how many calls go unanswered.
AdWave cites Opiniator's analysis that 68% of customers abandon a business due to perceived indifference (secondary). An unanswered call or a message left unread for days is one way that indifference can show up, which is an inference rather than a finding from the source.
Website steps can be checked in Google Analytics 4, which shows where visitors drop off.

What does a two-week mapping plan look like?

The schedule below is a suggestion, sized for an owner who can spare 30 to 45 minutes a day. It is not a benchmark from any source.

Week 1: gather

  • Day 1: write one objective in a sentence, such as "more first-time clients book a second visit."
  • Day 2: choose the stage model (five stages is used here) and write the stage names across a sheet of paper or a spreadsheet. Dedicated tools such as UXPressia or Smaply exist, and Miro and Mural offer templates, but none is required.
  • Day 3: list every touchpoint per stage, including offline ones like the front desk, phone and signage.
  • Day 4: read recent reviews and any survey replies, and tag each complaint with a stage.
  • Day 5: walk the journey as a new customer on a phone, from search to payment.
  • Days 6 and 7: pull existing numbers from the booking system, POS and listing dashboard.

Week 2: decide

  • Day 8: write one metric per stage and fill in a baseline. Mark gaps as unknown instead of guessing.
  • Day 9: list friction points, each with the stage it belongs to.
  • Day 10: score each friction point on how many customers it touches and how cheap it is to fix. Choose one.
  • Day 11: write the fix and the metric it should move.
  • Day 12: ship the fix.
  • Days 13 and 14: brief staff and set a review date a few weeks out.

What does one fix look like in a worked example?

A salon is used here. Every input below is an assumption for illustration, not data from a real business or a source.
Assumptions:
  • 1,000 people view the salon's Maps listing per month (assumption).
  • 8% of them tap the booking link or call (assumption).
  • Today, 50% of those who tap finish a booking, because the link opens a form that asks for a phone call during business hours (assumption).
  • An average first-visit ticket is $85 (assumption).
Baseline: 1,000 views times 8% gives 80 booking attempts. At 50% completion, that is 40 bookings per month.
Friction found: the walk-through on Day 5 showed the link lands on a "call us to confirm" page. The consideration-to-purchase step is where customers drop off.
Fix: replace that page with a self-serve calendar, as described in the salon online booking guide. Assume completion rises from 50% to 65% (assumption).
Result in the example: 80 attempts times 65% gives 52 bookings, which is 12 more per month. At $85, that is $1,020 in added first-visit revenue per month (assumption-based arithmetic, not a forecast).
The real lesson is the method. One stage, one metric, one change. After a few weeks of actual data, the completion rate replaces the assumed one, and the next friction point comes off the list.

Why do most journey maps fail, and how can that be avoided?

AdWave reports, citing Harvard Business School Online, that 67% of customer journey maps fail to drive organizational change because they are created as static artifacts without clear objectives (secondary). In a small business, the artifact is usually a drawing that sits in a drawer.
Three habits counter that:
  • Start with a written objective, as in Day 1 of the plan.
  • Limit each cycle to one fix, with a named owner and a review date.
  • Treat the map as a working sheet, updated after each fix.
Retention steps also need a schedule. Smith.ai recommends scheduling check-in calls after key usage milestones, such as the first week and the first month, to ensure proper adoption. That advice is framed for a different kind of product. A fitness studio could adapt it as a week-one and month-one check-in, which is an assumption about fit, not a tested practice.
Once the early stages are mapped, the next step is seeing how they look from the outside: the listing, the website and any ads. A free audit reviews those first touchpoints.

FAQ

How long does customer journey mapping take for a small business?

The plan above is sized for two weeks, but that timeline is a suggested schedule, not a figure from the sources. A smaller scope, such as one stage or one location, can be done faster. The review after the fix usually takes longer than the map itself.

Do I need journey mapping software?

No. The Chamber names UXPressia and Smaply as dedicated tools and Miro and Mural as template sites, but a one-page grid on paper or in a spreadsheet covers the method described here. Software helps when several people need to edit the same map.

Which stage should be fixed first?

Pick the stage where a measurable drop-off meets a cheap fix. If no stage has numbers yet, the purchase step is a practical start, since myPOS lists the ease of the checkout process among the factors in the purchase decision. Retention is the other candidate, given the 61% repeat-revenue figure cited above.

Why do sources list three, four or five stages?

Each author draws the boundaries differently. The Chamber groups the journey into three broad stages, PayJunction uses four, and Smith.ai and myPOS use five. None of the lists is wrong, so choose one and use it consistently.

Sources

Free for local businesses

Want this applied to your business?

I'll review your Google presence, local SEO, and ad accounts — and send you a specific action plan within 48 hours. No pitch, no pressure.

customer journeylocal marketingmarketing funnelsmall businessretention

Want hands-on help?

See how DataLatte handles Analytics & Reporting for local businesses.

Learn more
Nataliia — local marketing expert
Nataliia Rumiantsewa

Local marketing strategist with 10+ years at global agencies — OMD, Dentsu, GroupM, and BBDO. Now helping small businesses get the same data-driven edge. Based in Europe, working with clients in the US, UK, Australia, and beyond.

Want this applied to your business?

Let's review your current marketing setup together — free, no obligations.

Get Your Free Marketing Audit