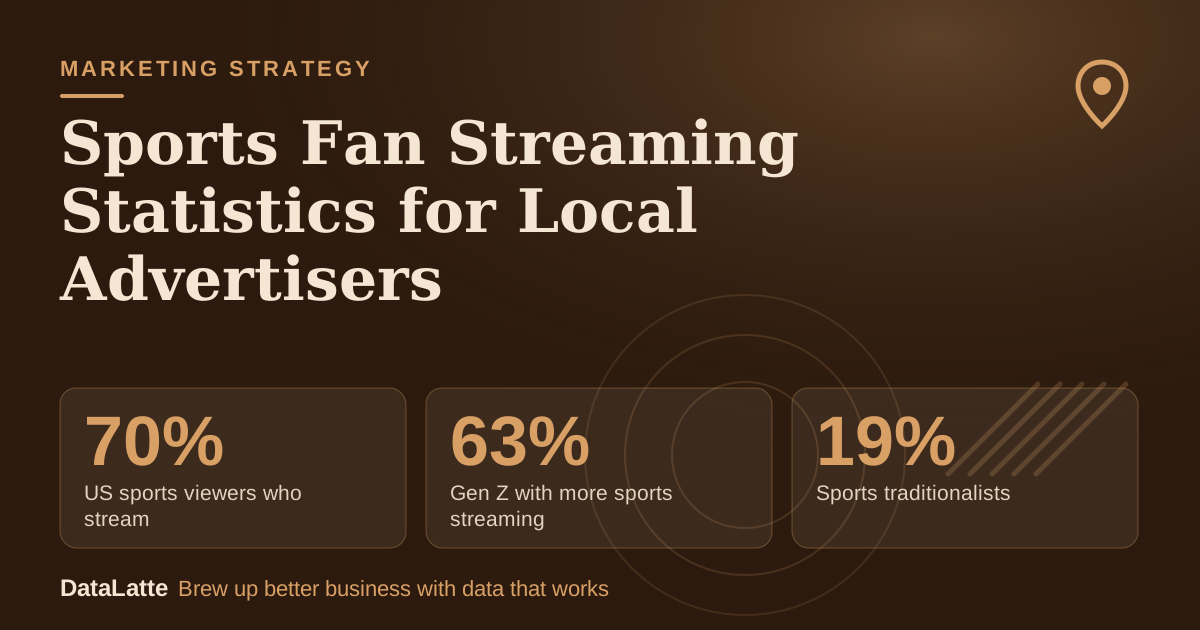
Most US sports viewers now stream. A Parks Associates and InterDigital survey from August 2025 found about 70% watch sports through streaming platforms, and 40% watch only that way, per a
vendor roundup of the survey (secondary). For a local advertiser, that means game-window ads belong mostly on streaming inventory. Every figure below is national, so each one needs a small local test before it gets real budget.
→
US sports viewers who stream
Parks Associates, Aug 2025, via AdWave (secondary)
↑
Gen Z with more sports streaming
Performance Research, Jul 2025, via AdWave (secondary)
↓
Sports traditionalists
Parks Associates, via AdWave (secondary)
→
March Madness avg viewers
Nielsen via EMARKETER, Apr 2026 (secondary)
See Sources at the end of the article. Cards marked Assumption are examples, not results.
How many sports fans actually stream?
The headline number is about 70% of US sports viewers. Of those, 40% watch exclusively through streaming and 30% use both streaming and traditional TV, according to the Parks Associates and InterDigital survey (released August 2025) as
repeated by AdWave (secondary). AdWave sells advertising, so treat its roundup as a retelling of other researchers' work, not independent research.
A second figure is higher. A Performance Research study from July 2025 found 90% of sports fans use at least one streaming service to watch live games, and 45% reported more streaming sports viewing than the prior year.
The same Parks research found that 43% of US internet households identify as sports viewers and that 84% of sports viewers watch at least one live event per week. Only 19% are "sports traditionalists" who watch exclusively through broadcast, cable, or satellite.
For a local business, the practical reading is simple. Streaming is the default way fans watch, and a minority stays on traditional TV only. The weekly viewing habit also means game windows come around every week, not only on championship days.
Growth in sports streaming skews young. Performance Research data (July 2025, via
AdWave, secondary) shows the share of viewers who increased their sports streaming year over year:
- Gen Z: 63%
- Millennials: 56%
- Gen X: 35%
- Boomers: 21%
Nielsen data cited in the same roundup says 67% of viewers aged 18-34 watch sports mainly via streaming or social clips, and 52% of those aged 35-49 prefer streaming over cable. The roundup gives no year for the Nielsen figures.
Older viewers behave differently. A
StackAdapt blog post (vendor, secondary) cites YouGov for 82% of US adults over 65 still favoring linear TV for sports, again with no year. The same post says people aged 25 to 44 make up most sports media consumers.
On platforms, Performance Research (July 2025) reported Amazon Prime Video at 65% usage among sports streaming viewers, ESPN+ at 39%, and Peacock at 37%. These are usage shares among streamers, not ad-buying options. A local advertiser usually cannot pick an app, so ask the seller which apps and games the local inventory covers.
What should a local advertiser do with each statistic?
The table pairs each figure with its source, year, and a suggested action. The actions are recommendations from DataLatte, not findings from the sources.
| Statistic | Source and year | What to do with it |
|---|
| About 70% of sports viewers stream; 40% only stream | Parks Associates and InterDigital, Aug 2025, via AdWave (secondary) | Make streaming the main test channel |
| 90% use at least one streaming service for live games | Performance Research, Jul 2025, via AdWave (secondary) | Treat as an upper bound; do not compare it with the 70% |
| 19% are traditionalists | Parks Associates, via AdWave (secondary) | A small linear-only group exists; do not plan around it |
| 84% watch a live event weekly | Parks Associates, via AdWave (secondary) | Test across several weeks, not one big game |
| Streaming growth: Gen Z 63%, Millennials 56%, Gen X 35%, Boomers 21% | Performance Research, Jul 2025, via AdWave (secondary) | Write offers for ages 18-44 first |
| 67% of 18-34 and 52% of 35-49 prefer streaming | Nielsen, year not stated, via AdWave (secondary) | Use as direction only until a year is confirmed |
| 82% of over-65s favor linear TV | YouGov, year not stated, via StackAdapt (secondary) | Reach older customers through other channels |
| 95.5M US digital live sports viewers, ahead of pay TV for the first time | Statista, 2023, via StackAdapt (secondary) | Historical context only |
| Average Super Bowl spend of $86.04 per American | NRF, 2024, via StackAdapt (secondary) | Food and drink offers fit big-game days |
Which of these statistics conflict or are out of date?
Several numbers look inconsistent but measure different things. The 70% figure counts viewers who watch via streaming platforms, while the 90% figure counts fans who use at least one streaming service for live games. The surveys, publishers, and months also differ.
Parks' 40% streaming-only, 30% both, and 19% traditionalist shares add up to 89%. The source excerpt does not explain the remaining 11%, so avoid building a plan on those categories summing to 100.
The audience size claims also differ by unit. EMARKETER's forecast says
nearly 50% of the US population are live sports viewers (secondary, since the piece retells Nielsen elsewhere). Parks says 43% of internet households identify as sports viewers. One counts people and the other counts households.
Old or undated data needs care. The Statista figure is from 2023, and the Super Bowl LVIII audience of over 123 million is from 2024. The Nielsen age splits and the YouGov 82% have no year in the sources. None of the figures describes a single city or ZIP code.
What does March Madness 2026 show about game windows?
EMARKETER, in an article dated April 2, 2026, reported that
March Madness TV viewership was the tournament's strongest in 33 years, up 9% year over year. It averaged 10.3 million viewers across TBS, CBS, TNT, and TruTV, per Nielsen (secondary, retelling Nielsen).
Specific windows stood out:
- The Friday window with St. John's-Duke and Michigan-Alabama drew 14.2 million viewers, up 38% and the most-watched in that slot since 1992.
- The Sunday Duke-UConn game averaged 13.4 million viewers, up 15%.
- The first two rounds averaged 10.1 million viewers, a record.
Two cautions apply. These are audience figures for national networks, and the excerpt does not say whether streaming views are included. Audience size also does not equal ad performance. A bigger audience gives a local ad more chances to be seen, but it says nothing about visits or sales.
How should a local business test game-window ads?
A test needs a trackable offer, a baseline, and several windows. The same plan fits a coffee shop, a salon, or a fitness studio, with the offer changed. A coffee shop might use a pregame drink code, a salon a booking link for a service, and a studio a trial-class page.
This week-by-week checklist assumes a five-week test:
- Week 1: Record normal weekly results with no game ads. Set up a unique code or QR landing page. See how to measure CTV ads for a local business.
- Week 2: Ask the seller for a geo-targeted quote covering the local radius and the apps covered. Get current rates in writing; no source here documents future price changes.
- Week 3: Run the first game window. Keep the offer the same across windows so results are comparable.
- Week 4: Run a second window on a different day or kind of game, such as a weeknight game against a weekend one.
- Week 5: Run a third window, then compare code redemptions and bookings against the Week 1 baseline.
- After Week 5: Keep, change, or stop. Decide on cost per new customer, not on views.
Cost matters before launch. The DataLatte guides on
real CTV CPM data and
whether CTV is worth it on a small budget cover pricing.
What does a worked example look like for a fitness studio?
Every input in this example is an assumption, not a benchmark. It shows the arithmetic, not an expected result.
Assumptions:
- Test budget: $1,200 across three game windows
- Cost per 1,000 impressions (CPM): $30
- Share of impressions that lead to a trial booking: 0.05%
- Trial-to-membership conversion: 25%
- Membership price: $120 per month
- Average membership length: 6 months
The math:
- $1,200 divided by $30, times 1,000, gives 40,000 impressions.
- 0.05% of 40,000 is 20 trial bookings, or $60 per trial.
- 25% of 20 trials is 5 new members, or $240 per member.
- Each member is worth $720 under the assumptions ($120 times 6), so 5 members are worth $3,600.
Break-even is $1,200 divided by $720, which is about 1.7, so 2 new members. If the booking rate halves to 0.025%, there would be 10 trials. At 25% conversion that is 2.5 members, worth about $1,800. The test would still cover its cost under these assumptions, but with little room for error.
If real results fall below break-even after three windows, the studio has learned that cheaply. Swap in the studio's real CPM quote, real membership price, and real retention before trusting any output.
FAQ
Do most sports fans watch on streaming or cable?
A Parks Associates and InterDigital survey from August 2025 found about 70% of US sports viewers watch via streaming, with 19% watching only through broadcast, cable, or satellite, per
AdWave's summary (secondary). Age matters: StackAdapt, citing YouGov, reports 82% of adults over 65 favoring linear TV (secondary, no year given).
They come from different studies and different questions. The 70% counts viewers who watch via streaming platforms, from Parks (August 2025). The 90% counts fans who use at least one streaming service to watch live games, from Performance Research (July 2025). Neither is a local number.
Are the March Madness numbers a guide to local ad results?
No. The 10.3 million average viewers and the 33-year high are national
Nielsen figures reported by EMARKETER (secondary). They show how large game windows can be, not how many local customers an ad will bring.
How much should a small business spend on a game-window test?
No source here sets a recommended budget or current ad prices. Ask the seller for current rates, then size the test so that break-even is a small number of new customers, as in the fitness studio example above. See the guide to
NFL CTV advertising for local business for a football-specific view.
Sources
- AdWave: Sports fans streaming statistics (vendor roundup, secondary; retells Parks Associates, InterDigital, Performance Research, AP-NORC, and Nielsen)
- EMARKETER: March Madness viewership soars to a 33-year high as marketers eye sports opportunities (April 2, 2026; retells Nielsen, secondary)
- StackAdapt: How to use sports fan buyer personas in programmatic campaigns (vendor blog, secondary; retells Statista, NRF, and YouGov)
Want help sizing a game-window test for one location? Request a
free audit and get a plan built around a real quote and a trackable offer.
Free for local businesses
Want this applied to your business?
I'll review your Google presence, local SEO, and ad accounts — and send you a specific action plan within 48 hours. No pitch, no pressure.