A local business can tell whether TV or streaming ads drove sales by combining three things: a trackable offer (a promo code or a vanity URL), a before-and-after baseline of bookings or sales, and a short test where the ads run for a set window. A customer survey works as a cross-check. Dashboards alone cannot settle the question, because every platform counts the conversions its own ads touched.
→
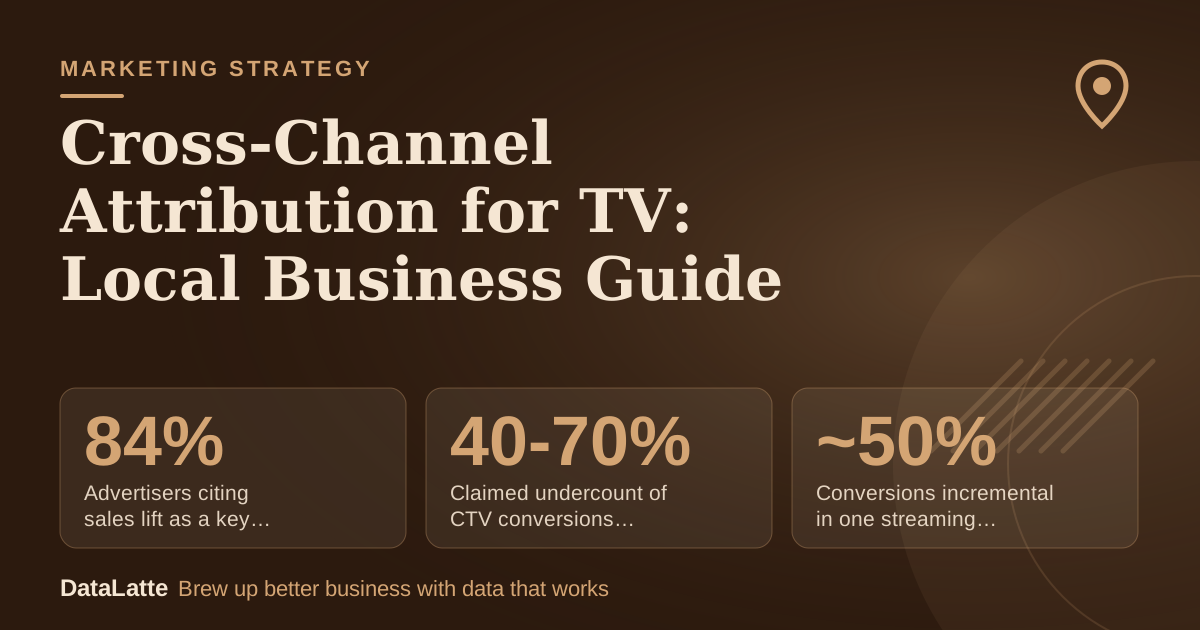
Advertisers citing sales lift as a key CTV metric
StackAdapt, published 2025-02-06 (vendor, secondary)
↑
Claimed undercount of CTV conversions in platform reports
Attn Agency guide, unsourced vendor claim (secondary)
↓
Conversions incremental in one streaming geo holdout
Adwave citing Measured research, one test (secondary)
→
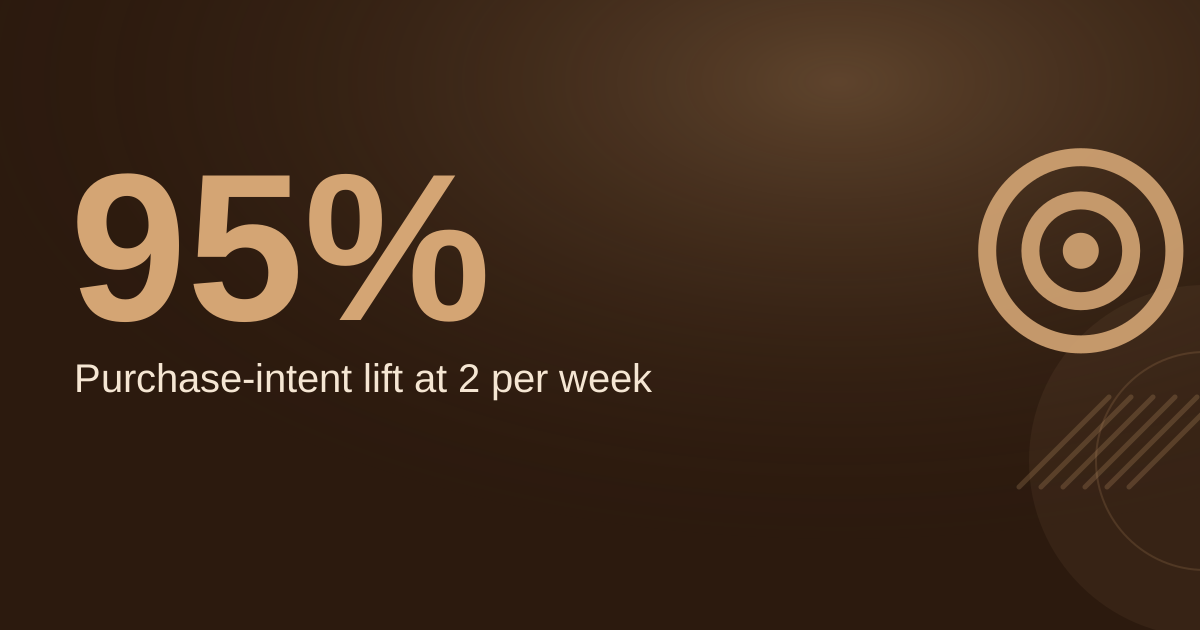
Time for a platform-report reconciliation check
Adwave, one month of data (secondary)
See Sources at the end of the article. Cards marked Assumption are examples, not results.
Each ad platform counts the conversions its own ads touched, using its own conversion definition and attribution window, so the totals across platforms can overlap (
Adwave, secondary). A sale that followed a streaming ad, a Google search and an email can show up in all three dashboards.
Google's documentation says data-driven attribution is now the default for most conversion actions in Google Ads, and GA4's Attribution reports list three models: data-driven and two last-click variants (same source, secondary). Data-driven and multi-touch models need user-level tracking, so they cannot follow linear TV or other media that cannot be tied to a person.
Single-touch models are simpler. StackAdapt defines first-touch as 100% of credit to the first interaction with a CTV ad, and last-touch as 100% of credit to the final interaction before conversion (
StackAdapt, secondary). Last-touch overvalues the final touchpoint and ignores everything before it.
Vendor claims also point in opposite directions. One geo holdout cited by Adwave found roughly half of the conversions a streaming platform claimed were incremental. An agency guide says platform reporting often shows 40-70% lower CTV conversions than reality, without a source (
Attn Agency, secondary). Both are vendor material, which is the reason to run a small test instead of trusting either number.
Which attribution methods fit a small budget?
Most methods that suit a local budget are low-tech. No benchmark is cited here for promo-code, vanity-URL, branded-search or survey response rates, so those rows describe what each method can show, not how much it will find. Effort ratings are a judgment call.
| Method | What it shows | Effort | Limits |
|---|
| Platform dashboard or data-driven model | Conversions each platform's own ads touched | Low | Overlapping totals; own definition and window; data-driven models cannot follow linear TV |
| Last-touch | Credit to the final click or view | Low | Overvalues the final touchpoint, ignores earlier exposure |
| Promo code on the TV or streaming spot | Redemptions from viewers who remember and use the code | Low | Counts only people who use it; a floor, not the total |
| Vanity URL or QR code | Visits and signups from people who typed or scanned it | Low to medium | Misses viewers who search the business name instead |
| Branded search trend | Whether searches for the business name rise during the flight | Low | Shows interest, not sales; other channels can move it too |
| Post-purchase survey ("How did you hear about us?") | Self-reported influence, including TV | Low | Relies on memory; one answer hides multi-channel journeys |
| On/off or geo holdout test | Extra sales versus a comparison period or area | Medium to high | Needs a stable baseline; rigorous designs need large budgets |
| Marketing mix modeling | Statistical contribution of each channel | High | Needs at least 2 years of daily sales data per the Attn Agency guide (secondary) |
Phone bookings need their own tracking, covered in
call tracking for small businesses compared. Online bookings and forms can be tracked in GA4, which is covered in
GA4 for small business.
Why is a full geo holdout out of reach, and what is a practical version?
An incrementality test splits people or areas into a treatment group that sees ads and a holdout that does not. The difference in sales between the two is the lift the ads caused (
Adwave, secondary). Streaming TV suits this because most streaming platforms support geographic targeting exclusions, and a test typically takes several weeks to cover the lag between seeing an ad and buying.
The design in the Attn Agency guide is built for much larger advertisers. It calls for 20 or more matched market pairs, a control group with CTV paused or reduced by 50-80%, 6-12 weeks minimum, a p-value below 0.05, and typically $100K or more in monthly spend for enough statistical power. The guide targets DTC brands spending $50K or more monthly (all secondary).
A single-location business cannot meet that design. A practical version compares weekly bookings in the weeks before the flight with the flight weeks and a short tail afterward, and optionally excludes a few ZIP codes from targeting as a rough comparison. Weekly counts at one location are small, so ordinary swings can look like lift. Read the result as directional.
How long should the attribution window be?
Short windows undercount TV. The Attn Agency guide recommends 14-30+ days for CTV view-through because 1-day windows miss most conversions, and its example configuration uses a 30-day click window for search (secondary). It also lists a 14-day primary window for beauty and skincare, with a 28-day extended window said to capture 85% or more of conversions, and a 21-day primary window for apparel. Those figures are vendor benchmarks for online product brands, not for salons or studios.
For a local service business, the takeaway is structural: keep counting after the ads stop. A booking made 10 days after a streaming spot still belongs in the test. The calendar below reserves a final week for exactly that.
Frequency matters for reading results as well. The same guide splits audiences into heavy (8 or more impressions per person per week), medium (4-7) and light (1-3) exposure for segment tests. Few local campaigns have person-level exposure data, but the tiers are a useful reference when setting caps. See the
ad frequency guide.
What does a 6-week test calendar look like?
Hold other channels steady for the full six weeks. A new email push or a discount in week 3 makes the result unreadable. GA4's recommended events such as generate_lead are suggested for conversions that occur offline, and they are not sent automatically because they need additional context (
Google Analytics Help). Setting one up in week 1 means the signup or booking is counted consistently.
| Week | Actions | Check at the end of the week |
|---|
| 1 | Pull 8 prior weeks of bookings or sales as a baseline. Create the promo code and vanity URL. Add the survey question. Set up the GA4 event and call tracking. Freeze other promotions. | Baseline average written down; every booking path tracked |
| 2 | Launch the TV or streaming flight. Confirm the code and URL appear in the creative. | Ads delivering; code and URL tested end to end |
| 3 | Keep the flight running. Log weekly bookings, code redemptions, URL visits, branded search. | Any change in other channels recorded |
| 4 | Keep the flight running. Compare weekly bookings to the baseline average. | Direction of the gap noted, no budget changes yet |
| 5 | Final flight week. Record the survey tally. | Survey answers counted by source |
| 6 | Ads off. Keep counting bookings and redemptions to catch lagged conversions. | Final lift, cost per extra booking, platform-claimed total |
How does a worked example look for a fitness studio?
A single-location fitness studio runs a six-week streaming test to drive trial signups. Every input below is an assumption for illustration, except that the CPM falls inside the $15 to $30 range StackAdapt says is often seen in CTV (
StackAdapt, vendor, secondary). Local quotes can differ, so current rates need to be requested.
| Input | Value (all assumption) |
|---|
| Flight budget | $3,000 |
| CPM | $20 |
| Baseline trial signups | 12 per week (average of prior 8 weeks) |
| Total signups across the 6 weeks | 102 (about 17 per week) |
| Promo code redemptions | 9 |
| Platform dashboard claimed conversions | 48 |
| Trial-to-member rate | 40% |
| Membership price and length of stay | $90 per month, 6 months |
The math:
- Impressions: $3,000 divided by $20, times 1,000, gives 150,000.
- Expected signups at baseline: 12 times 6 weeks gives 72.
- Extra signups: 102 minus 72 gives 30.
- Cost per extra signup: $3,000 divided by 30 gives $100. The dashboard's 48 claimed conversions imply $62.50 each, which flatters the result.
- Value per signup: 0.40 times $90 times 6 gives $216. Thirty extra signups are worth $6,480 against $3,000 spent.
The promo code's 9 redemptions are a floor, not the answer. The lift of 30 is a better estimate, but it assumes nothing else changed. A seasonal rush, such as a January resolution surge, would inflate it, which is why week 1 requires freezing other promotions. If survey answers show roughly the same share of new members naming streaming TV, the three methods agree and the estimate gains credibility.
What should a small business do with the result?
Treat one test as a decision aid, not proof. If cost per extra signup lands below the value per signup, repeat the flight at the same budget and see whether the lift holds. If it does not, change one variable, such as the creative or targeting, and retest. Changing several at once makes the lift unreadable.
Advertisers also report on more than sales. StackAdapt cites 86% prioritizing reach and frequency, 84% sales lift, and 77% website visit attribution as important CTV reporting metrics (secondary, published February 2025). A local test can cover the second and third with the setup above.
Streaming budgets and costs are covered in
local TV advertising cost for small business. Formal survey-based approaches are in
brand lift studies for small advertisers.
FAQ
Can a local business use data-driven attribution to measure TV?
Only partly. Multi-touch and data-driven models need user-level tracking, so they cannot follow linear TV or other media that cannot be tied to a person (
Adwave, secondary). They work better for digital touchpoints. For TV, a promo code, a vanity URL and a baseline comparison fill the gap.
How much does streaming TV cost per 1,000 impressions?
StackAdapt says CTV CPMs often range from $15 to $30, higher than other digital advertising (vendor, secondary). Local quotes vary by platform, targeting and season. Ask each seller for current rates in writing before building a test budget.
How long should a TV attribution test run?
Adwave says an incrementality test typically takes several weeks, long enough to cover the lag between ad and purchase. A rigorous geo test per Attn Agency runs at least 6-12 weeks and needs large budgets (both secondary). A six-week single-location test, with a lag week at the end, is directional only.
Is a "How did you hear about us?" survey enough?
A survey is a cross-check, not proof. It records memory and one answer per customer, so it understates multi-channel journeys. Combined with a promo code and a baseline comparison, it helps confirm whether TV is part of the path.
Request a free audit to set up tracking for a TV or streaming test before the budget goes live.
Sources
Free for local businesses
Want this applied to your business?
I'll review your Google presence, local SEO, and ad accounts — and send you a specific action plan within 48 hours. No pitch, no pressure.