For a small business, the first email A/B test should be the subject line, then send day, then the offer, then the call to action. Change one element per test, send each version to a small random slice of the list, and send the better version to everyone else. On a small list, treat a result as a direction to retest, not a proven rule.
→
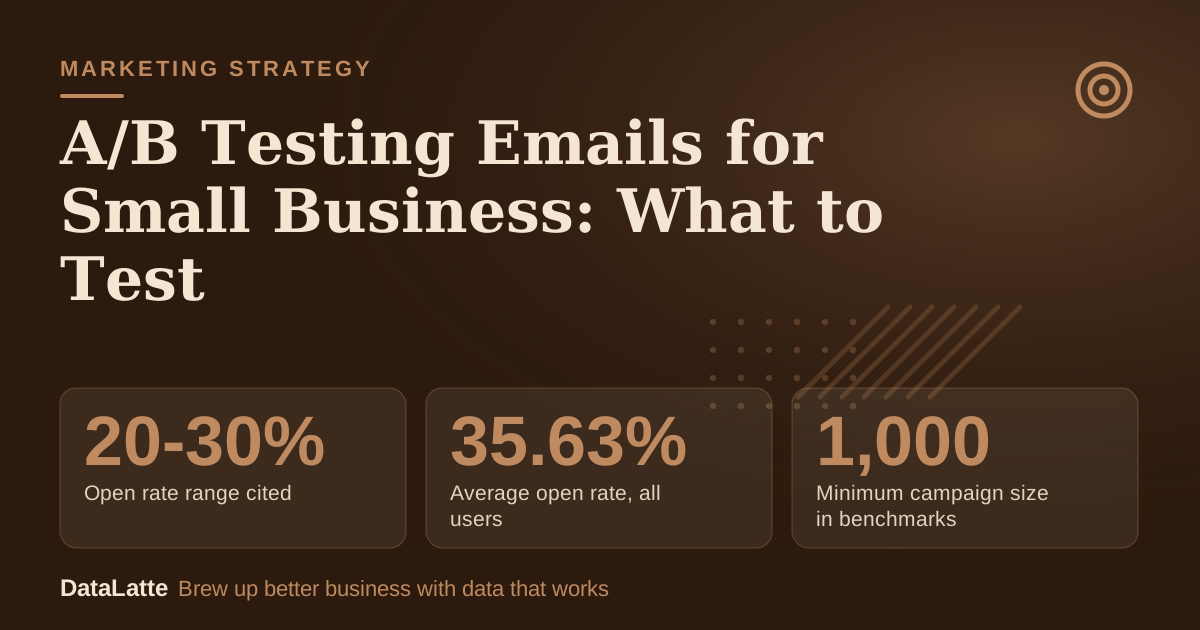
Open rate range cited
AdWave (secondary), range given without a source
→
Average open rate, all users
Mailchimp (secondary), as of December 2023
→
Minimum campaign size in benchmarks
Mailchimp (secondary), campaigns to 1,000+ subscribers
↑
Uplift in a described subject test
AdWave (secondary), brackets vs colon
See Sources at the end of the article. Cards marked Assumption are examples, not results.
How does an email A/B test work?
A valid test has two versions of the same email. Version A is the control and Version B is the variation, with
only one difference between them (secondary). If the subject line, the offer and the button all change at once, there is no way to tell which change moved the result.
The same page recommends sending each version to a small, random slice of the list, then sending the winner to the remaining audience. Random matters: sending version A to regulars and version B to people who rarely open would measure the audience, not the email.
The page also describes a subject-line test on 4,000 subscribers. "[Sale] Get Our Products For 50% Off" reached a 13.25% open rate, while "Sale: Get Our Products For 50% Off" reached 12.5%. The page reports the brackets-versus-colon change as a 0.75% uplift. It is a single retold example, so it shows how small a real difference can be, not what works in general.
What should a small business test first?
Start with the element that is cheapest to change and closest to the first action, which is the open. Then move down the email toward the click and the booking. The table below sets out a sensible order, what to measure, and any limits a source gives.
| Order | Test | What to change | What to measure | Source note |
|---|
| 1 | Subject line | Wording, length, or punctuation | Open rate | Mailchimp (secondary) suggests no more than 9 words and 60 characters, no more than 3 punctuation marks, and no more than 1 emoji |
| 2 | Send day | Same email, different weekday | Open rate, click rate | A Databox study cited by Selzy (secondary) reports most marketers see the best engagement on Tuesday emails; the list's own result matters more |
| 3 | Offer | The incentive itself, such as a free add-on versus a discount | Click rate, redemptions | No benchmark in the sources; compare against the list's own past sends |
| 4 | Call to action | Button wording or placement | Click rate | Mailchimp (secondary) describes click rate as how many delivered emails prompted a click |
| 5 | Frequency | Sends per week or month | Unsubscribe rate, complaints | Treated separately below because it needs weeks, not one send |
Open rate is defined as the percentage of recipients who open an email, and click rate is based on delivered emails. Track both. A subject line that lifts opens but not clicks has only changed who looks, not who acts.
How big does the list need to be for a test to mean anything?
The sources do not give a minimum list size for a valid A/B test, and none gives a significance formula or threshold. Any number quoted as "the right sample size" is therefore not documented here, and a small business should be wary of anyone who states one with confidence.
What the sources do show is scale. Mailchimp's benchmark data only included campaigns sent to
at least 1,000 subscribers (secondary). A list below that size is outside the data behind those averages, so comparing to them is loose at best.
The described AdWave test used 4,000 subscribers and produced a 0.75-point gap. On a list of a few hundred, each version might be sent to only a hundred or so people. At that size, a handful of opens can swing the winner.
Three practical consequences follow for a small list:
- Test big contrasts, not tiny wording tweaks. Brackets versus a colon is a poor test for a list of 800.
- Repeat a promising result on the next send before treating it as a rule.
- Keep a log, so several small tests pointing the same way add up to something.
What do benchmarks say, and how far can they be trusted?
Benchmarks help answer one question: is a send in a sensible range? They cannot say whether a test result is real. The data below is Mailchimp's own, as of December 2023, so it is nearly three years old at the time of writing.
| Industry (Mailchimp, as of December 2023) | Average unique open rate |
|---|
| Ecommerce | 29.81% |
| Business + Finance | 31.35% |
| Education + Training | 35.64% |
| Non-Profits | 40.04% |
| All Users | 35.63% |
Mailchimp (secondary) also states that its data suggests an optimal click-through rate of 2.66 percent and an open-rate target of about 34.23 percent, varying by industry. The page lists no category for salons, coffee shops, pet groomers or fitness studios in the figures used here, so the all-users row is the closest neutral reference.
The AdWave page says open rates can hover anywhere from 20-30%, but it gives no source for that range. The two ranges differ, which is a reason to compare a list to its own history first. For a wider look at what counts as a good result, see
CTR and conversion rate benchmarks for local business.
What does a 6-week testing calendar look like?
One test per send keeps results clean. The calendar below assumes one campaign email per week. Sources differ on cadence: Selzy (secondary) cites studies suggesting a baseline of 1-3 emails per month, while OptiMonk (secondary) recommends 1-3 per week for most ecommerce stores. A business sending monthly can stretch each week below into one send. More on pacing is in
how often a small business should send emails.
| Week | Task | Variable changed | Measure |
|---|
| 1 | Pull the last 5 to 10 sends, note open and click rates, and set up random splitting | None (baseline) | Own open and click averages |
| 2 | Subject line test 1: a plain subject versus a specific one | Subject line only | Open rate |
| 3 | Subject line test 2, or repeat week 2's winning style on a new topic | Subject line only | Open rate, click rate |
| 4 | Offer test: two incentives of similar value | Offer only | Click rate, redemptions |
| 5 | Call-to-action test: button wording or position | CTA only | Click rate |
| 6 | Send-day test, then review the whole log and check unsubscribes and complaints | Send day only | Open rate, click rate, unsubscribe rate |
At the end of week 6, keep the changes that held up in more than one test. Drop the ones that did not repeat.
What does a worked example look like for a salon?
All inputs below are assumptions for illustration, not real results.
A salon has 1,200 email subscribers (assumption). It plans a rebooking email and tests two subject lines: A is "Time for a trim?" and B is "Book your trim this week" (assumption). Each version goes to a random 200 people, and the other 800 receive the winner after the test.
Assumed results: version A gets 56 opens (28%), and version B gets 68 opens (34%). Clicks are 9 for A and 10 for B.
Reading it honestly: the gap is 12 opens. If 6 of B's opens had gone to A instead, the two would tie at 62 each. That is a small number of people, so the result is a lean toward B and not a verdict. Clicks barely moved, 9 against 10, so the stronger open rate has not yet turned into more bookings.
The sensible decision is to send B to the remaining 800. If B held its assumed 34%, that is 272 opens, against 224 at A's assumed 28% (assumption). Then log it and run a similar contrast next send. Two sends pointing the same way carry more weight than one.
Segmenting by past behavior, as in
RFM segmentation for small business, can make later tests cleaner. Lapsed clients and regulars respond differently.
How should results be read honestly?
A result is worth acting on when the gap is large, it repeats, and it does not damage anything else. Four checks help.
First, look at both open and click rates. A subject line that lifts opens by a few points while clicks stay flat has not produced more bookings.
Second, compare the gap with the size of the slice. A difference of a few opens on a slice of a couple hundred people is within the range of ordinary variation, even though no threshold is documented in the sources.
Third, watch the guardrails. OptiMonk (secondary), writing about ecommerce, flags an unsubscribe rate above 0.3% per send as a sign of sending too much, and calls a spam complaint rate above 0.1% a hard ceiling. A winning email that pushes either number up is not a win. The same page suggests that when two or more red flags appear together, frequency should be cut by 25-30% for two weeks and then re-measured.
Fourth, check revenue, not only email metrics.
Google Analytics 4 for small business shows whether clicks became visits and bookings, and
email campaign ideas that drive revenue gives topics worth testing.
For help connecting email results to the rest of local marketing, request a
free audit.
FAQ
What is the first thing a small business should A/B test in an email?
The subject line. It affects open rate, it is quick to change, and it needs no design work. Mailchimp (secondary) suggests keeping subject lines to no more than 9 words and 60 characters, with no more than 3 punctuation marks and no more than 1 emoji, which gives a useful frame for the two versions.
How many subscribers are needed for an A/B test?
The sources used here do not state a minimum. Mailchimp's benchmark averages only include campaigns sent to at least 1,000 subscribers, so a smaller list sits outside that data. On a small list, test large contrasts and repeat promising results before treating them as rules.
Can more than one thing change in a test?
Not if the goal is to learn what caused the difference. A valid test changes only one element between the control and the variation, according to AdWave (secondary). Changing the subject line and the offer together shows which email did better, but not why.
What open rate counts as good?
Mailchimp's own data, as of December 2023, lists an all-users average unique open rate of 35.63%, and an ecommerce average of 29.81%. AdWave (secondary) cites a 20-30% range without a source. A list's own history is the more useful comparison.
Sources