Footfall Attribution: Measuring Store Visits From Ads
November 13, 2026·Nataliia Rumiantsewa· 9 min read All posts
Footfall attribution (also called foot traffic attribution) is a measurement method that connects in-store traffic to digital marketing campaigns (secondary). It matches pseudonymous mobile-device signals to the ads those devices saw, then compares exposed customers with a control group. For a small store, it can work alongside simpler tools such as promo codes and geo tests, which are covered below.
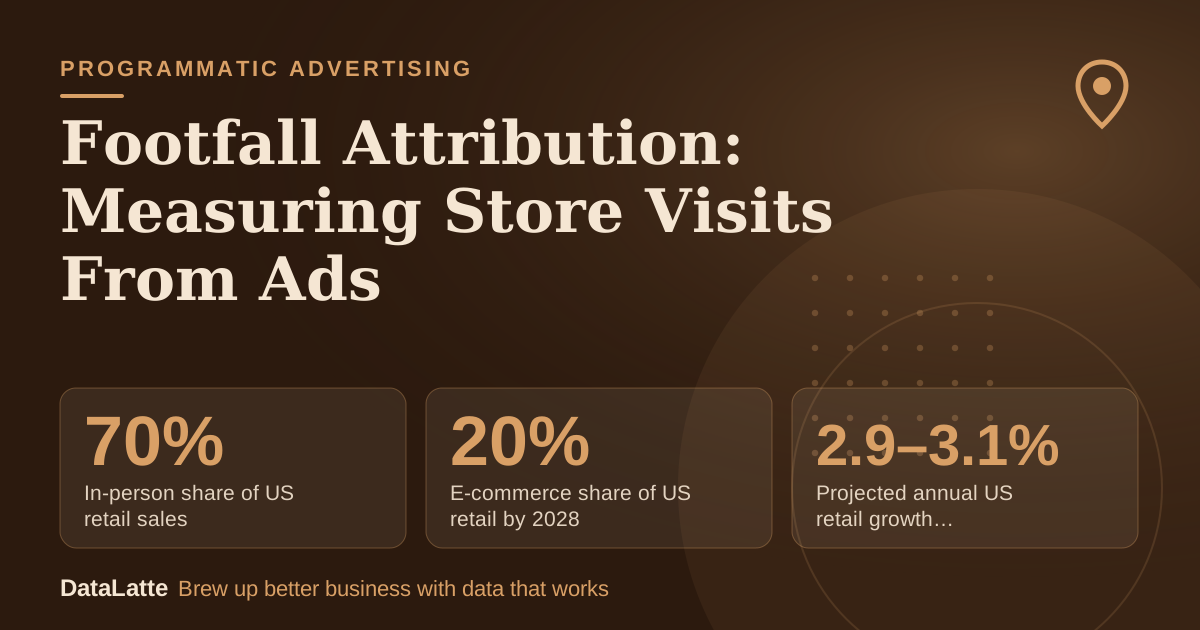
70%→
In-person share of US retail sales
NRF, cited by StackAdapt (secondary)
20%↑
E-commerce share of US retail by 2028
EMARKETER forecast, cited by StackAdapt (secondary)
2.9–3.1%↓
Projected annual US retail growth through 2028
Versus a 3.6% pre-pandemic average (NRF, secondary)
$8–$25→
Mobile geofenced ad CPM
Adwave geofencing guide (secondary)
See Sources at the end of the article. Cards marked Assumption are examples, not results.
What is footfall attribution and how does it work?
Footfall is measured by pseudonymously tracking signals from mobile devices and matching those signals to ads the customers saw (secondary). The output is an uplift figure: how many more visits happened among people who were exposed to the campaign than among a control group that did not see the ads.
StackAdapt states that its verified third-party location partners report on the actual devices that may have visited a location after seeing an ad, along with projected future visits, in near-real-time. A 2022 StackAdapt post (secondary) adds that foot traffic attribution is made possible through integrations with partners.
Visit rate is one metric in this setup. It identifies the average daily visits by specific customer segments.
Once visits are counted, cost per store visit (secondary) can be calculated. That puts a physical-world result next to the usual online numbers such as impressions and clicks. Multi-location vendors (secondary) also describe centralized reports that put foot traffic and revenue attribution next to impressions and conversions.
Why does in-store measurement matter for a local business?
Most local sales still happen in person. According to NRF, 70% of retail sales still occur in person (secondary). EMARKETER forecasts e-commerce at 20% of total US retail sales by 2028, so the physical till remains the main place where an ad either pays off or does not.
Click-based reports miss that. A person can see a streaming ad on the couch, search the shop name later, and walk in on Saturday. No click is recorded in the ad dashboard. The result is a campaign that looks weak online while the front door is busier.
The same source page states that high footfall indicates strong customer interest (secondary) and that higher footfall generally leads to more sales because more potential customers can mean more purchases. Visits are a leading signal, not revenue, so they still need to be checked against the till.
For streaming and connected TV spend in particular, visit-based measurement is one way to judge results. The OTT advertising guide for local business covers that channel in more detail.
What can footfall attribution not tell a small business?
The first limit is wording. Vendor reports describe devices that "may have visited" a location. That is an estimate of exposed devices near a place, not a receipt. A visit to a salon building could also be a neighbor's errand, a delivery, or an employee shift.
The second limit is the missing sale. A counted visit says nothing about whether the person bought anything, how much they spent, or whether they were already a regular. Existing clients inflate visit counts for repeat-visit businesses such as coffee shops and studios.
The third limit is scale. Geofenced mobile ads carry a typical minimum budget of $500 to $1,000 per month (secondary). Whether a tiny campaign produces enough visits for a stable uplift comparison is not documented in the sources reviewed. Ask any vendor about minimum spend, minimum visit volume for reporting, and how the control group is built.
The fourth limit is that one dashboard is one view. Cross-checking against a promo code, a booking field, and point-of-sale totals gives a more reliable picture than any single number.
How do privacy and consent shape store-visit data?
Two practical effects follow for a small business. Only devices with location sharing turned on can appear in the data, so the numbers describe a subset of the real crowd. And a business never receives a list of who walked in.
Methods that avoid device data altogether exist. Contextual targeting, for example, places ads based on the content viewed rather than on browsing history or personal data (secondary). Measurement can also rely on information customers hand over themselves, such as a code at checkout or an answer to "how did you hear about us?"
Before signing with any vendor, ask where the location data comes from, how consent is collected, and what the report shows at the individual level. Reviewing the answers in writing is a sensible step for any business that handles customer information.
Which measurement methods fit a small store?
Footfall attribution is one option among several. The table below compares methods by what they count and where they fall short. Prices appear only where a source documents them. Otherwise, ask the vendor for current rates.
Method
What it counts
Cost signal from sources
Main limit
Platform footfall attribution
Estimated visits from exposed devices vs a control group
Not documented; ask for minimums
Estimates only; consenting devices only
Mobile geofencing with visit reporting
Visits to the area around a store
CPM $8 to $25; minimum often $500 to $1,000 per month
Budget floor; visit is not a sale
CTV or streaming geofencing
Households in a zip-level area
CPM $20 to $40; minimums often $50 to $100
Moderate zip-code precision
Promo or offer code
Redemptions of a code tied to one campaign
Cost of the discount (assumption-dependent)
Misses people who do not use the code
Geo test (matched areas)
Sales or bookings in ad areas vs similar non-ad areas
How do promo codes and geo tests work in practice?
Promo codes are the oldest method and still useful. Give each campaign its own code, such as a 20% in-store discount or a first-50-customers offer. The Adwave foot traffic guide (secondary) lists these as example offers, and also a free item on every 10th visit as an example of a loyalty reward. Those are illustrations, not tested results. Staff then log each redemption.
Geo tests are rough. Weather, school breaks, or a competitor's sale can distort a single month. Repeating the test improves confidence.
What does a worked example look like for a salon?
This example uses assumptions throughout. None of the inputs are measured results.
Assumptions: a hair salon runs a four-week mobile geofenced campaign with a $600 budget (inside the $500 to $1,000 typical minimum range). The campaign CPM is $15 (inside the $8 to $25 range). The offer is a new-client code, "GLOW". The average first-visit ticket is $85.
Calculation:
$600 divided by a $15 CPM per thousand gives 40,000 impressions.
At a frequency of 4 impressions per device per week (inside the recommended 3-5 cap for mobile) over 4 weeks, each device sees 16 impressions. That reaches about 2,500 devices.
Assume the platform reports 70 attributed visits. Cost per attributed visit is $600 divided by 70, or about $8.57.
Assume the front desk logs 12 new-client bookings with the code. Cost per code-tracked new client is $600 divided by 12, or $50. First-visit revenue is 12 times $85, or $1,020.
The two numbers answer different questions. The 70 visits include existing clients and people who never booked. The 12 codes undercount new clients who forgot to mention the code. The true figure sits somewhere between them, which is why both are worth logging. Margin and rebooking rates also decide whether $50 per new client is acceptable. Those are not in this example.
What is a week-by-week plan for a first test?
A four-week campaign needs a short prep period and a review. The sequence below fits a single-location business. Adjust the dates around a quiet or busy season so the comparison stays fair.
Week 1, before launch: pull the last 8 weeks of bookings or sales from the till or booking system as the baseline. Choose the ad radius and a comparison area. Create one unique code. Add a "how did you hear about us?" field to booking or checkout.
Week 2, launch: start the campaign with a set frequency cap. Brief staff to ask for the code and record it every time. Confirm with the vendor how visits are counted and when reports arrive.
Week 3, mid-flight check: compare code redemptions and any early visit report with the baseline. Do not change the offer, the creative, and the radius at the same time. One change keeps the comparison readable.
Week 4, last full week: keep logging. Note anything unusual, such as holidays, weather, or a competitor promotion.
Week 5, review: set platform visits, code redemptions, "how did you hear" answers, and till totals side by side. Calculate cost per visit and cost per new customer. Decide whether to repeat, adjust, or stop.
The sources reviewed do not document minimum spend or minimum visit volume for footfall reporting. Geofenced mobile campaigns typically carry minimum budgets of $500 to $1,000 per month (secondary), while CTV geofencing often starts at $50 to $100. Ask each vendor for current minimums and reporting thresholds.
Do promo codes replace footfall attribution?
No, they cover different ground. Codes count only people who redeem them, while footfall tools estimate visits from exposed devices. Using both and comparing them gives a range rather than a single figure.
Does footfall measurement identify individual customers?
Footfall is measured by pseudonymously tracking signals from mobile devices (secondary), and StackAdapt states that data is collected only after notice, consent, and location sharing are in place. Ask any vendor for its consent process in writing.
For help setting up a store-visit test with codes and a control area, request a free audit or see the Google Ads service.
Local marketing strategist with 10+ years at global agencies — OMD, Dentsu, GroupM, and BBDO. Now helping small businesses get the same data-driven edge. Based in Europe, working with clients in the US, UK, Australia, and beyond.