Local Ad Spend 2026: What the Forecasts Mean for You
How much will local advertisers spend in 2026?
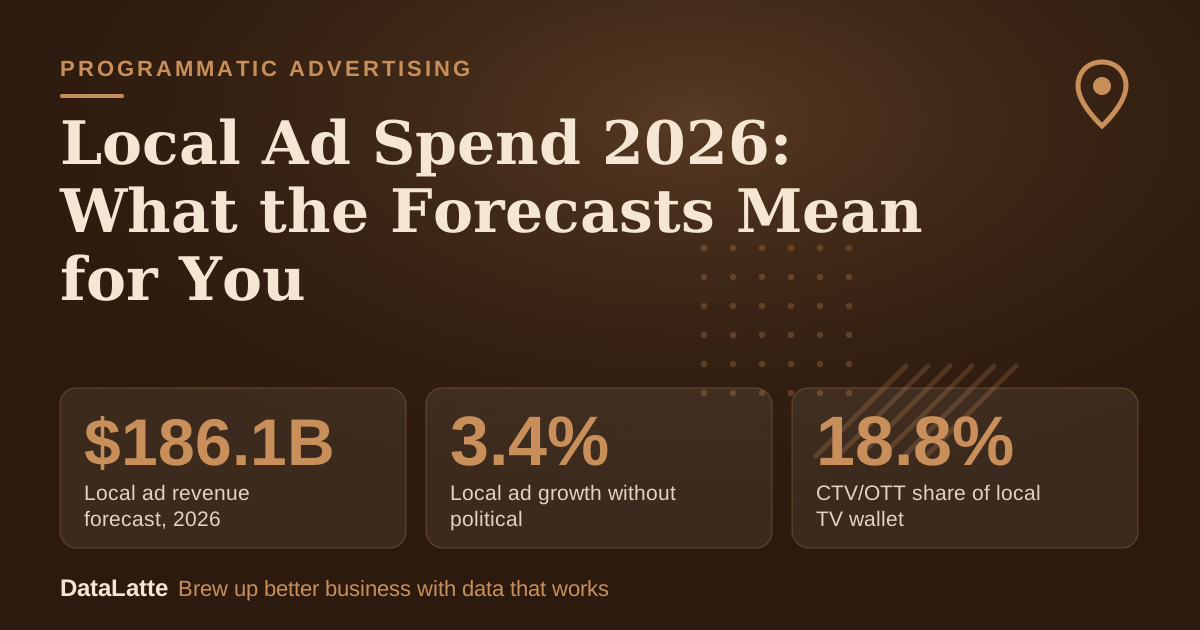
Local ad revenue forecast, 2026
BIA via Webtonic, includes political (secondary)
Local ad growth without political
BIA via Webtonic, excludes political (secondary)
CTV/OTT share of local TV wallet
BIA via Webtonic, up from 13.9% in 2024 (secondary)
Average planned CTV spend increase
Advertiser Perceptions and Premion survey via Advanced Television (secondary)
See Sources at the end of the article. Cards marked Assumption are examples, not results.
Why does political spend change the headline numbers?
Where is local ad money moving: TV, CTV, search, social or direct mail?
| Channel | What the sources say | Political spend note | Local takeaway |
|---|---|---|---|
| Local TV (linear) | Headline growth is lifted by political money. Among CTV advertisers who plan to raise CTV spend, the funding not coming from budget growth is reallocated from linear TV, display, search and social (Advanced Television, secondary). | Headline totals include political; the 3.4% does not | Do not read election-year totals as a signal that broadcast works better for a small advertiser |
| Local CTV/OTT | Share of the local TV wallet rises from 13.9% in 2024 to 18.8% in 2026, spend reaches $3.6B, growth is 9.7% (BIA via Webtonic, secondary) | Stated as excluding political | The fastest-growing line inside local TV, from a small base |
| Search | Google's methodology claims an average return of $8 in profit per $1 spent on Google Ads (Google Economic Impact, via Webtonic, secondary) | Not applicable | A vendor's own average, not a promise for any one account |
| Social | National social video is forecast at $31.9B, up 13%, and passed CTV in spend in 2025 (IAB and Guideline, via Adwave, secondary) | Not applicable | National figure; no local-only forecast appears in these sources |
| Direct mail | No forecast or figure appears in the sources used here | Not applicable | Treat as a test with a tracked offer code, not a benchmark-led choice |
Why are CTV forecasts so far apart?
What are other small businesses doing with their budgets?
What should a small business copy, and what should it avoid?
- Efficiency over volume. In the Constant Contact figures, 50% of owners are pursuing efficiency strategies and 33% are testing new tools.
- Streaming as a complement to other channels. Four in five surveyed advertisers say linear plus CTV works better than either alone. Nearly nine in ten say CTV in an omnichannel plan improves performance. Both come from CTV advertisers, so the claim is self-reported. It still suggests streaming as one layer, not a replacement for search.
- Review work before spend. BrightLocal's 2026 survey, quoted in the roundup, finds 97% of consumers read local reviews. It also finds 31% will only use a business rated 4.5 stars or higher, up from 17% the year before.
- Reading the $186.1 billion total as proof that local media has become more effective.
- Copying a national CTV advertiser's plan. Local reach, creative and frequency needs differ, and the small-budget CTV worth-it guide covers where the break points are.
- Skipping measurement. Without analytics set up first, a paid test cannot be judged. The Google Analytics 4 setup guide covers the basics.
What does a 90-day budget split look like for a local service business?
| Line | Share (assumption) | Amount | Notes |
|---|---|---|---|
| Google Search | 35% | $2,100 | About $23 a day, running all 13 weeks |
| Social ads | 20% | $1,200 | About $13 a day, running weeks 4 to 13 |
| CTV flight | 25% | $1,500 | About 50 days at $30 a day, weeks 5 to 11 |
| Direct mail test | 10% | $600 | One tracked drop with an offer code |
| Reviews, creative, tracking | 10% | $600 | Set up in weeks 1 to 2, maintained after |
| Week | Action | Check |
|---|---|---|
| 1 | Install analytics, set conversion events for trial bookings and calls | Test a booking and confirm it records |
| 2 | Audit reviews on Google and other listings; reply to open ones; request new reviews | Rating and review count noted as a baseline |
| 3 | Launch search with a daily cap | Search terms reviewed for waste |
| 4 | Add social ads with one offer and two creatives | Cost per trial booking noted |
| 5 | Start CTV flight; ask the seller for current rates and dates | Confirm creative meets ad specs |
| 6 | Send the direct mail drop with a unique code or QR link | Count code uses weekly |
| 7 to 8 | Midpoint review across all channels | Pause the weakest line, keep the data |
| 9 to 11 | Run the CTV flight to its end; keep search and social steady | Compare trial bookings in flight weeks to non-flight weeks |
| 12 | Decide what repeats; move budget from the weakest channel | Written note on what changed and why |
| 13 | Final report: cost per trial, per new member, per channel | Plan the next 90 days |
FAQ
Is the $186.1 billion local ad forecast good news for small businesses?
Should the 9% and 24% figures be averaged?
Will local ad prices fall after the election cycle?
Is $30 a day enough to start on CTV?
Sources
- MediaPost: Local 2026 Advertising: +24% On Big Political Gains (secondary)
- Webtonic: Where Local Advertising Budgets Are Going This Year (secondary; reports BIA, Constant Contact, LocaliQ, Premion, BrightLocal and Google figures)
- Advanced Television: Survey: 70% CTV advertisers to increase spending by 17% in 2026 (secondary)
- Adwave: How big is the connected TV advertising market? (secondary; reports IAB, Guideline and eMarketer forecasts)
Free for local businesses
Want this applied to your business?
I'll review your Google presence, local SEO, and ad accounts — and send you a specific action plan within 48 hours. No pitch, no pressure.
Want hands-on help?
See how DataLatte handles CTV Advertising for local businesses.

Local marketing strategist with 10+ years at global agencies — OMD, Dentsu, GroupM, and BBDO. Now helping small businesses get the same data-driven edge. Based in Europe, working with clients in the US, UK, Australia, and beyond.
Related articles

Roku Ads for Local Business: Cost and Setup
8 min read
Podcast Advertising for Coffee Shops
10 min read
Google Display Network for Local Businesses
9 min read
DV360 for Small Business: Is It Worth It?
8 min readWant this applied to your business?
Let's review your current marketing setup together — free, no obligations.
Get Your Free Marketing Audit