November 12, 2026·Nataliia Rumiantsewa· 9 min read All posts
A local business can tell whether ads work by doing four things. Set one measurable goal. Record baseline numbers before launch. Track a cost metric (cost per lead or cost per acquisition) next to a revenue metric (ROAS or ROI). Then test whether the results would have happened without the ads. AdWave's TV attribution guide recommends at least 4 weeks of baseline data (secondary) before a campaign goes live. The sections below cover metrics by channel, ROAS versus cost per lead, incrementality tests, and a weekly scorecard.
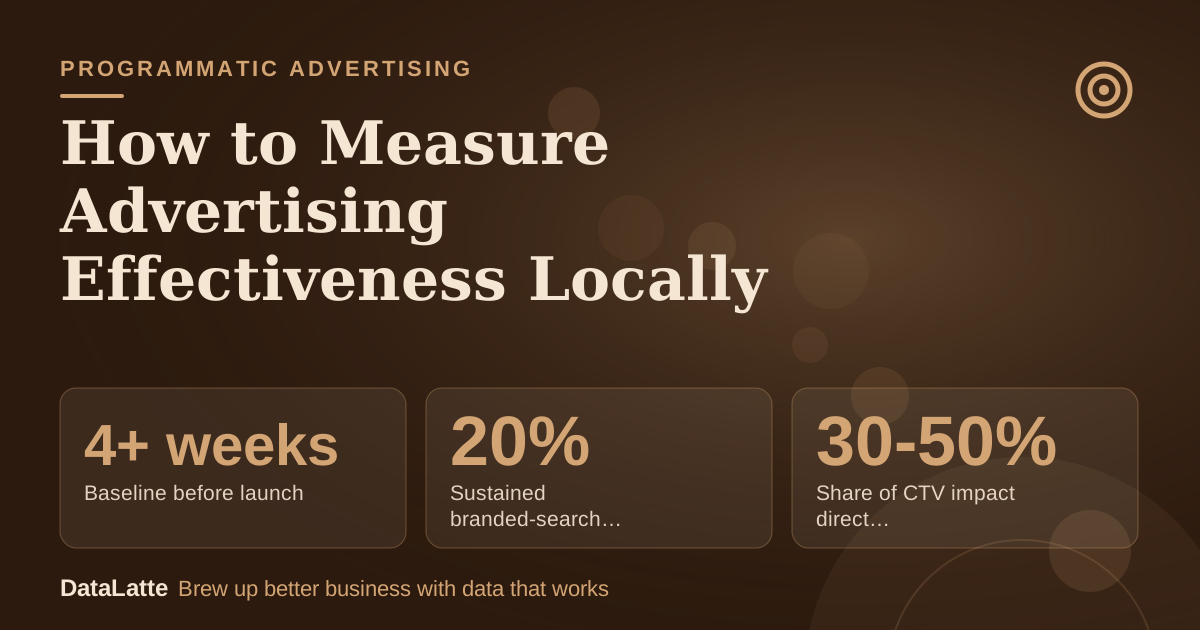
4+ weeks→
Baseline before launch
AdWave TV attribution guide (secondary)
20%↑
Sustained branded-search lift treated as a strong signal
AdWave TV attribution guide (secondary)
30-50%↓
Share of CTV impact direct attribution usually captures
See Sources at the end of the article. Cards marked Assumption are examples, not results.
What should be decided before the first ad runs?
Measurement starts with a goal that a number can settle. Advertising research has moved a long way since the 1950s, when it began with simple "Do you remember this ad?" surveys (secondary). Even so, a goal stated in plain numbers is still the first step.
AdWave's ROI guide gives sample objectives. One is 30 qualified leads through a website in a month (secondary). Another is 20% more inbound phone calls from a TV campaign over a quarter. A third is 50 new gym members from a local advertising push before year end. All three name a count, a source and a deadline.
Three inputs should be written down before launch:
the goal in numbers
the budget
the starting point
For the starting point, the same vendor suggests recording branded search volume, website traffic, phone call volume and new customer counts for at least 4 weeks. A separate line in the guide says 4 to 8 weeks (secondary) works for before/after comparison. Without that record, a later "increase" has nothing to be compared against.
Which metrics belong to each channel?
Each channel reports different numbers, and mixing them causes confusion. The table lists what to watch weekly and the benchmark ranges AdWave publishes. These are vendor benchmarks, not guarantees. The sources contain no benchmarks specific to coffee shops, salons or groomers, so the nearest category is shown.
Channel
Weekly numbers to log
Vendor benchmark (AdWave, secondary)
Google Search ads
Cost per acquisition, ROAS, landing-page conversion rate
ROAS 2-6x for service businesses, 3-8x for retail and e-commerce. CPA $35-$120 for local services, $15-$60 for retail and e-commerce
Meta (social) ads
CPA, ROAS, results by creative
ROAS 1.5-5x for service businesses, 2-7x for e-commerce. CPA $15-$60 for e-commerce DTC, $100-$400 for high-ticket services
CPM $15-$35, about $25 average. ROAS 1.5-4x directly attributed, 3-7x with cross-channel lift. Frequency 3-5 per household
Local SEO and Google Business Profile
Calls and form fills from the listing
Typical cost $0-$500 per month. Estimated 8-20x return on the equivalent budget
Two notes on the table. AdWave states that a search ad sending traffic to a slow or confusing page often shows 50-70% lower conversion (secondary) than the same ad sent to an optimized page. On Meta, the same audience, offer and landing page with two creatives can produce 3-5x different conversion rates. So a weak result may point to the page or the creative, not the channel.
ROAS, ROI or cost per lead: which one fits a local business?
The three numbers answer different questions.
Cost per lead (or cost per acquisition) is ad spend divided by leads or customers. It suits businesses where the sale happens later, such as a studio booking trial classes.
ROAS is an efficiency metric (secondary) that compares gross revenue with ad spend only. ROI accounts for total cost, using the formula (Revenue Generated - Marketing Cost) / Marketing Cost × 100.
The same guide's restaurant example shows how the two relate. A $3,000 TV campaign with a "BRUNCHTV" promo code brought 80 tables. At $150 per table, that is $12,000 in revenue. ROAS is 4x ($12,000 divided by $3,000), and ROI is 300%. The 4x and the 300% describe the same campaign.
The illustrative example in the guide has $20,000 of spend producing $100,000 of new revenue, for an ROI of 400%.
Revenue is not profit. Neither figure subtracts product or labor cost unless that cost is included in the "marketing cost" or tracked separately. For membership businesses, recurring dues matter too. A membership-marketing article from Raklet (secondary) notes that regular fees or dues are a common revenue model, unlike a one-time sale. First-purchase ROAS can therefore understate what a member is worth, though the sources give no retention benchmark.
How can a result be tied back to an ad?
Attribution rules decide which channel gets credit. First-touch attribution gives 100% of the credit to the first channel (secondary) a customer engaged with. Last-touch gives 100% to the final touchpoint before conversion. Neither shows the full path, so a single rule can over-credit one channel.
Practical tracking methods from the sources:
A unique promo code on the ad, such as the SAVE15 example, that people mention when calling or ordering.
A "how did you hear about us" question at booking or checkout. AdWave expects 10 to 25% of new customers (secondary) to name TV or streaming in surveys, and says actual influence is likely higher.
Direct attribution also undercounts. AdWave says it usually captures only 30-50% of CTV's real impact (secondary). That is a vendor estimate, so promo-code counts are best read as a floor.
What is incrementality, and how can a small business test it?
Incrementality asks how many sales happened because of the ads, not merely after them. A business that advertises in a busy season will see sales rise regardless. The sources describe three practical tests.
The first is a before/after comparison against the baseline. AdWave calls a sustained increase of 20% or more in branded searches (secondary) a strong signal that TV advertising is working. It lists 20 to 40% as a realistic range during active campaigns, and 15 to 30% for direct and organic website traffic.
The second is an on/off test. After a campaign has run at least 60 days, pause it for two weeks, then restart and compare.
The third is a geo test. It compares new customer growth, branded search and revenue between an advertised market and a held-out one after 90 days.
Published incrementality data comes from the vendors themselves. Universal Ads reports a median of about 5% incremental lift and about 1.1x iROAS (secondary, vendor-reported) across its geo lift studies. Top campaigns reach 7%+ lift and about 2x. The studies are labeled 2025-2026, in-scope N=60. Its case examples (an apparel brand at 14.9% lift and 1.59 iROAS, a home brand at 15.2% lift) are selected by the vendor and come from brands, not neighborhood shops. They suggest modest lift is normal, not that a local result will match.
Timing matters as well. AdWave says brand lift is measurable in 30 to 60 days (secondary), and clear ROI attribution typically takes 60 to 90 days. It cites Video Advertising Bureau research that CTV ads typically need 3 to 5 exposures to drive measurable action. A verdict after one week is premature. See whether CTV is worth it on a small budget for the budget side.
How does a fitness studio work through the numbers?
The inputs below are all assumptions, built to show the arithmetic. They are not benchmarks. A fitness studio runs a one-month streaming campaign aimed at trial sign-ups. Platform options are compared in CTV platforms compared for 2026, and category tactics are in CTV ads for fitness studios.
Input or result
Value
Basis
Ad spend for the month
$1,500
Assumption
Monthly trial sign-ups in the 4-week baseline
40
Assumption
Trial sign-ups in the campaign month
46
Assumption
Trial-to-member conversion
40%
Assumption
Revenue per member over their stay
$1,200
Assumption ($120 per month for 10 months)
Cost per lead, counting all 46 sign-ups
$32.61
$1,500 / 46
Incremental sign-ups
6
46 minus 40
Cost per incremental sign-up
$250
$1,500 / 6
New members from incremental sign-ups
2.4
6 x 40%
Revenue from those members
$2,880
2.4 x $1,200
ROAS on incremental revenue
1.92x
$2,880 / $1,500
ROI
92%
($2,880 - $1,500) / $1,500
Cost per lead of $32.61 looks efficient. Against the baseline, however, only 6 of the 46 sign-ups are extra, so the cost per incremental sign-up is $250. Both numbers are correct, and they answer different questions. This is also why a trial membership is worth tracking separately. The Raklet article mentions trial memberships (secondary) as a way to help prospects decide before committing.
One month of data is a weak test, since the baseline may carry seasonality. Repeating the calculation after the 60-90 day window gives a steadier read.
What does a week-by-week measurement calendar look like?
The calendar below follows the timings in the sources, from a 4-week baseline to a 90-day comparison.
Weeks -4 to -1: record weekly branded search volume, website traffic, call count and new customers. Set up promo codes, a booking-form "how did you hear" field and analytics.
Week 1: launch. Check delivery only: CPM, completion rate and frequency. AdWave cites 90% or higher completion for 30-second non-skippable CTV ads, against skip rates often above 70% (secondary) for YouTube pre-roll.
Weeks 2-4: add leads, cost per lead and promo-code redemptions to the log. Avoid judging revenue yet.
Weeks 5-8: compare branded search, traffic and calls with the baseline. Watch for the 20% sustained signal.
Week 9 or later (day 60 or beyond): run the two-week pause, restart, and compare.
Weeks 12-13 (about day 90): compare new customers, branded search and revenue to baseline, or between test and held-out markets. Work out ROAS, ROI and cost per incremental customer.
A weekly scorecard needs only one row per week with ten columns: spend, impressions, CPM, leads, cost per lead, new customers, revenue, ROAS, branded search volume and call count. A few lines of notes on pricing changes, holidays or weather make the later comparison fairer.
FAQ
How long does it take to know if ads are working?
AdWave says most small businesses see measurable brand lift in 30 to 60 days, and clear ROI attribution typically takes 60 to 90 days of consistent campaigning (secondary, vendor claim). Delivery metrics such as completion rate can be checked in week one, but revenue conclusions need more time.
Is a promo code enough to measure results?
A promo code counts only the people who use it. AdWave expects 10 to 25% of new customers to name TV or streaming in surveys and says direct attribution usually captures 30-50% of CTV impact (secondary). Codes work best as a minimum count alongside baseline comparisons.
What is a good ROAS for a local business?
AdWave publishes ranges such as 2-6x for Google Search service businesses and 1.5-5x for Meta service businesses (secondary). These are vendor benchmarks. ROAS also ignores costs beyond ad spend, so the ROI calculation and the margin on each sale should be checked as well.
What is the difference between ROAS and ROI?
ROAS measures gross revenue against ad spend only. ROI accounts for total cost, using (Revenue Generated - Marketing Cost) / Marketing Cost × 100. In the restaurant example, the same campaign is a 4x ROAS and a 300% ROI.
How many times does someone need to see an ad?
Video Advertising Bureau research, as cited by AdWave, suggests CTV ads typically need 3 to 5 exposures to drive measurable action. AdWave also lists 3-5 per household as the best-performing frequency (secondary).
For a free review of a current tracking setup, or help planning a Google Ads test with a clean baseline, request a free audit or see Google Ads services.
Local marketing strategist with 10+ years at global agencies — OMD, Dentsu, GroupM, and BBDO. Now helping small businesses get the same data-driven edge. Based in Europe, working with clients in the US, UK, Australia, and beyond.