Multi-Touch Attribution for Small Business: Data Guide
November 14, 2026·Nataliia Rumiantsewa· 26 min read All posts
Multi-touch attribution (MTA) splits the credit for one sale or lead across several marketing touches instead of giving it all to one. For a small advertiser, it is worth using as a directional tool once paths include several channels, and it should be paired with simpler checks such as promo codes, "how did you hear about us" questions and call tracking. Below: how each model works, what GA4 actually offers, and where MTA breaks.
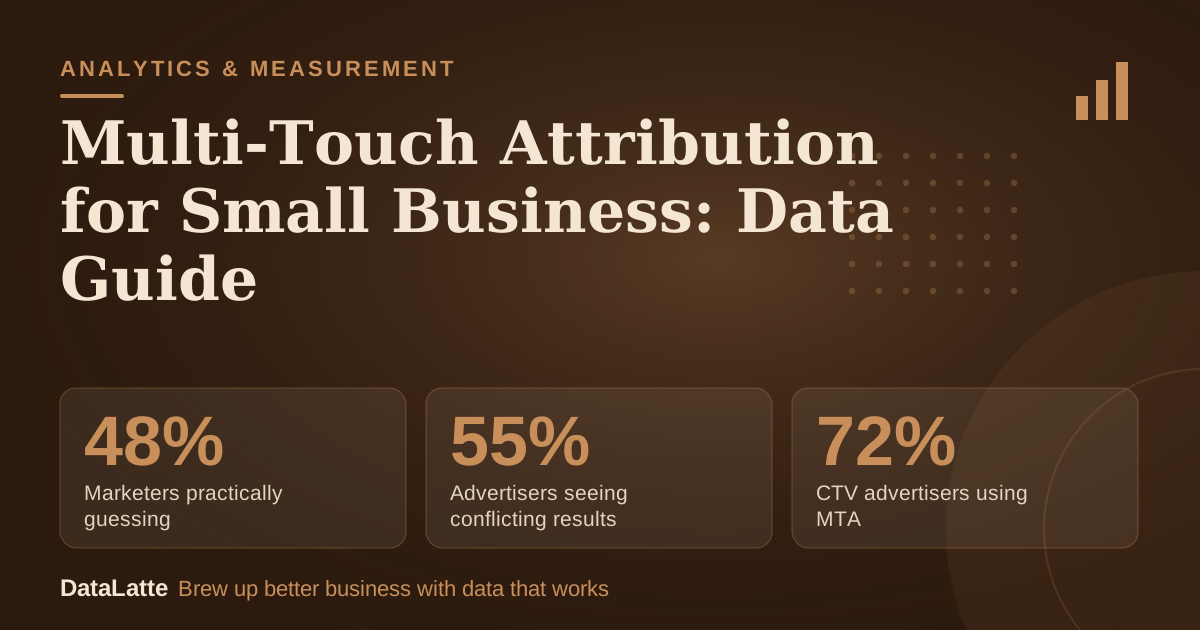
48%→
Marketers practically guessing
eMarketer via StackAdapt, 2026 (secondary)
55%→
Advertisers seeing conflicting results
Kantar via StackAdapt, 2025 (secondary)
72%↑
CTV advertisers using MTA
IAB via Adwave, 2025 (secondary)
52.5%→
Journeys spanning multiple channels
StackAdapt, about 5M paths (secondary)
See Sources at the end of the article. Cards marked Assumption are examples, not results.
48%
Nearly half of marketers say they are practically guessing which efforts lead to conversions
Study cited by StackAdapt, attributed to eMarketer, 2026. Vendor retelling, not a primary study.
StackAdapt blog (secondary)
Key findings
Marketing attribution models fall into two groups, single-touch and multi-touch, according to StackAdapt (secondary).
GA4 Attribution reports offer 3 models: data-driven, paid and organic last click, and Google paid channels last click. The first click, linear, time decay and position-based models were no longer available as of November 2023 (Google Analytics Help).
All GA4 attribution models exclude direct visits from credit unless the whole path is direct (Google Analytics Help).
55% of advertisers frequently see conflicting results across their measurement tools, and they use nearly four tools on average, per a 2025 Kantar study cited by StackAdapt (secondary).
StackAdapt's analysis of about 5 million conversion paths found 52.5% spanned multiple channels (StackAdapt, secondary, own platform data).
Cross-device matching rates quoted by one vendor guide run 40-60% for deterministic, 60-80% for probabilistic and 70-85% combined (Attn, secondary).
StackAdapt advises using MTA for directional optimization and treating it as less definitive on causality (StackAdapt, secondary).
Last-touch credit goes to the final clicked ad, which can undercount TV (Adwave, secondary).
What is multi-touch attribution and why does it matter for a small business?
Multi-touch attribution assigns partial credit to each touchpoint in a customer's path to purchase, instead of crediting one touch only. Adwave (secondary) describes it exactly that way: a model that assigns partial credit to each touchpoint. Single-touch models, by contrast, hand all credit to one interaction.
The reason it matters is simple. People rarely convert after one ad. A prospect may see an Instagram ad, search the studio name, open the Google listing and then book. A report that credits only the final click makes the earlier touches look worthless, and budget gets cut from the channels that started the journey.
The measurement problem is widespread, not a small-business quirk. 78% of US decision-makers think at least 10% of marketing spend is wasted due to insufficient measurement, per StackAdapt (secondary, citing eMarketer). Small advertisers feel this more sharply because each wasted dollar is a larger share of the budget.
How widely measurement trouble is reported (different populations, see caption)
US decision-makers: 10%+ spend wasted
78%
Advertisers with conflicting results
55%
Marketers practically guessing
48%
Consumers: path to purchase is random
47%
Mobile leaders: privacy hurts attribution
41%
Each bar has its own denominator and year: eMarketer-cited (US decision-makers), Kantar 2025 (advertisers), eMarketer 2026 (marketers), StackAdapt (consumers), Branch 2025 (mobile leaders). All via StackAdapt, secondary.
55%
More than half of advertisers frequently get conflicting results from the measurement tools they already run
Kantar 2025 study: nearly four measurement solutions used on average.
Kantar via StackAdapt (secondary)
An honest caveat applies to all of this. Most of the statistics above come from an ad-tech vendor's blog retelling other studies. They show that the industry struggles with measurement. They do not show that a particular model will fix a particular small business.
What are the six attribution models and how does each one credit a sale?
StackAdapt (secondary) states that 6 attribution models are commonly used. Five are formula-based and one, data-driven, learns weights from data. The table below lists what each does.
Model
Type
How credit is assigned
Best suited to
First touch
Single-touch
100% to the first interaction
Judging which channels create awareness
Last touch
Single-touch
100% to the final interaction before conversion
Short, one-channel sales cycles
Linear
Multi-touch
Equal credit to every touch point
Journeys where every touch is believed to matter
Time decay
Multi-touch
More credit to touches closer to the conversion
Promotions with a clear deadline
Position-based (U-shaped)
Multi-touch
40% to first and last touch, rest divided among the middle
Journeys where discovery and closing both matter
Data-driven
Multi-touch
Algorithm weights credit using journey data, no predefined formula
Accounts with enough conversion data
Definitions follow StackAdapt (secondary) and Adwave (secondary) for first and last touch.
A W-shaped model, described in the same StackAdapt article, gives 30% each to the first touch, the last touch and the point where a prospect becomes a lead, then divides the remaining 10% among other touches. It suits longer B2B funnels with a clear lead stage more than a walk-in business.
W-shaped model: how 100% of credit is split
First touch30%30%
Lead-creation touch30%30%
Last touch30%30%
Other touches10%10%
Split as described by StackAdapt (secondary). Position-based, the U-shaped version, gives 40% each to first and last touch.
Each formula encodes a belief. First touch believes discovery is what matters. Last touch believes closing is. Linear believes nobody can say. None of them measures cause and effect; they only redistribute credit across touches that were already observed.
How does GA4 credit conversions, and what happened to the old models?
Google Analytics 4 is where most small advertisers will meet attribution. The Attribution reports offer 3 models: data-driven attribution, paid and organic last click, and Google paid channels last click, per Google Analytics Help. The help page also states that the first click, linear, time decay and position-based models were no longer available as of November 2023.
That has a practical consequence. A small business cannot flip between all the textbook models inside GA4. The linear or position-based views in this guide have to be built by hand, in a spreadsheet or in a separate tool.
The two last-click options differ in scope:
Paid and organic last click ignores direct traffic and gives 100% of the key event value to the last channel clicked. Google also calls this model "Last non-direct click"; the two names refer to the same model.
Google paid channels last click gives 100% of the value to the last Google Ads channel clicked before converting. It falls back to paid and organic last click when the path has no Google Ads click.
Direct visits get no credit
All GA4 attribution models exclude direct visits from receiving credit, unless the path to the key event consists entirely of direct visits (Google Analytics Help). A customer who types the studio name after seeing an ad is credited to the earlier channel, not to "direct".
Data-driven attribution is specific to each advertiser and each key event. It incorporates factors such as time from key event, device type, number of ad interactions, order of ad exposure and type of creative assets. Depending on data availability, it may use aggregate data from Data sharing settings. Conversions can be reattributed for up to 7 days after the conversion. Engaged views count when a user watches an ad for 30 seconds, or to the end if shorter.
Only a user with the Marketer role or above at the property level can change attribution settings. Check who holds that role before assuming the setting is correct. More on setup basics is in the GA4 for small business guide.
7 days
In data-driven attribution, conversions can be reattributed for up to a week after they happen
Google Analytics attribution help page. Reports for the latest days can therefore still change.
Google Analytics Help
What counts as a conversion that attribution can credit?
Attribution only works on events that are measured. GA4 does not send recommended events automatically, because they need extra context to be meaningful, per Google Analytics Help on recommended events. Someone has to configure them.
For a service business, the relevant group is the lead generation set: generate_lead, qualify_lead, disqualify_lead, working_lead, close_convert_lead and close_unconvert_lead. Google recommends these for business-to-business sales, automotive sales, insurance sales, or generally when conversions occur offline, and sending them populates the Lead acquisition report.
That matters for salons, studios and groomers whose real conversion happens at the front desk. A form fill is not a membership. If only the form is tracked, attribution credits channels for leads that may never convert. The offline step needs to flow back, for instance through a qualified or closed-won style event, so the model sees the outcome that pays.
The same help page lists 14 recommended events for all properties, including purchase, login, sign_up and search. A shortlist for a local business could be: lead or booking form, phone-call click, direction request, and the sale itself. Which events to mark as key events is a business decision, not a technical one.
For details on how sessions and clicks differ when reconciling platform numbers, see sessions vs clicks. Phone-heavy businesses should read the call tracking comparison before trusting any web-only attribution.
How do time-decay windows behave in practice?
Time decay is the easiest model to misunderstand because the decay curve is a choice. Attn (secondary, vendor guide for DTC brands) gives a schedule in which a CTV conversion on day 1 gets 100% attribution value, falling to 50% on day 3, 25% on day 7 and 12.5% on day 14. The same guide also shows a linear example with full value on day 1, 50% on day 7 and 0% on day 14.
Two different curves from the same page prove the point: the slope is set by the analyst. A longer sales cycle needs a longer window, and a shorter one a steeper curve.
Time-decay schedule from one vendor guide: attribution value by days since exposure
Example schedule from Attn (secondary). Not a standard; the curve is a modelling choice.
The same guide recommends extended attribution windows of 14 to 30+ days for CTV, because 1-day windows miss most conversions. It lists benchmarks by category: 14 days for beauty and skincare (a 28-day extended window captures 85%+ of conversions, per the guide), 21 days for apparel and 30 days for home and garden. These are one vendor's statements, with unsourced origins, and apply to online DTC products rather than gym memberships.
For a local business, the takeaway is to match the window to the real time between first contact and booking. A coffee shop's window may be a day. A wedding venue's may be months. Observe the gap in the booking data before picking a number.
14-30+ days
Traditional one-day windows miss most conversions, so connected TV needs a longer attribution period
Recommendation from a DTC CTV measurement guide. Vendor view, not a controlled study.
Attn (secondary)
How do ad platforms and cross-channel tools credit conversions?
Every ad platform reports conversions through its own lens, with its own windows and rules. The sourced points are narrow. Google's GA4 documentation shows data-driven attribution is specific to each advertiser and event, and Adwave notes that last-touch credit gives the win to the final clicked ad, which undercounts TV (Adwave, secondary).
Another side of the same issue appears in a vendor claim that platform reporting often shows 40-70% lower CTV conversions than reality (Attn, secondary, unsourced). Treat it as a hypothesis about undercounting, not a measured rate.
The practical implication: totals from different platforms will not add up. If Meta, Google Ads and the booking system each claim the same sale, the sum of claims exceeds actual sales. That overlap is the reason a neutral source, such as the booking system or point-of-sale data, must act as the reference for total conversions.
Adwave also describes ROI attribution as using UTM parameters, tracking pixels and analytics platforms to trace the journey across touchpoints and channels (Adwave, secondary). Consistent UTM tags are the cheapest piece of this and the one most often skipped. For view-based credit versus click-based credit, the view-through vs click-through guide goes deeper.
Last-touch reporting still has a role. StackAdapt says it can help teams understand the final interaction before conversion (StackAdapt, secondary). Its limits show up when the journey is not single-channel: 52.5% of the roughly 5 million StackAdapt-influenced conversion paths in the company's own analysis spanned multiple channels.
Share of conversion paths touching multiple channels (StackAdapt-influenced paths)
About 5 million paths
53%
48%
Spanned multiple channels (52.5)
Did not (remainder) (47.5)
52.5% is reported by StackAdapt (secondary, its own platform data, so not representative of all advertisers). The 47.5% is the remainder of 100.
52.5%
More than half of conversion journeys in one vendor's dataset spanned multiple channels
About 5 million StackAdapt-influenced conversion paths. The dataset is the vendor's own.
StackAdapt, June 2026 (secondary)
How do cross-device behavior and privacy limit multi-touch attribution?
Attribution needs to recognize that touches belong to the same person. When someone sees an ad on a phone and books on a laptop, the model may see two unrelated users. Matching methods try to bridge this. Attn (secondary) states that deterministic matching typically achieves a 40-60% match rate, probabilistic 60-80%, and a combined approach 70-85%.
Typical cross-device match rates quoted by one vendor guide
Low end
High end
Deterministic
40%
60%
Probabilistic
60%
80%
Combined
70%
85%
Ranges from Attn (secondary). Even the best case leaves 15% or more of journeys unmatched. Not a measured benchmark.
Even at the best quoted rate, a meaningful share of journeys stay unmatched, and unmatched users look like new customers with a single touch. That pushes credit toward whatever touched them last on the device they converted on.
Privacy adds a second layer. In a Branch 2025 report, 41% of mobile growth, marketing and product leaders worldwide said privacy measures are creating greater attribution challenges (StackAdapt, secondary). Direct-visit exclusion in GA4 and the use of aggregate data in data-driven models point in the same direction: less user-level detail over time.
41%
Four in ten mobile growth and marketing leaders say privacy measures are making attribution harder
Branch 2025 report of mobile growth, marketing and product leaders worldwide, cited by StackAdapt.
StackAdapt (secondary)
For a local business there is a further blind spot that no cookie bridges. A visit to the store, a call or a referral by word of mouth leaves no digital trace unless captured deliberately. Footfall methods are covered in the store-visit attribution guide.
When is multi-touch attribution worth it, and when are simpler methods enough?
MTA earns its place when a customer journey includes several paid or tracked channels and when conversions are numerous enough to compare paths. Below that, the model reshuffles credit among a handful of conversions and produces noise that looks like insight.
Simpler methods answer narrower questions with fewer assumptions. StackAdapt recommends MTA for directional optimization, not causality, and marketing mix modeling (MMM) for higher-level planning when user-level tracking is limited (StackAdapt, secondary). It also reports that 52% of US brand and agency marketers use incrementality experiments.
Method
Question it answers
Data needed
Budget and skills
Main limit
Promo code or unique URL
Which campaign did this sale come from?
Code field at checkout or front desk
Very low, no analyst
Misses people who do not use the code
How-did-you-hear question
What do customers recall?
One form or POS field
Very low
Recall bias; favors the last or most memorable touch
On geo testing, a vendor guide for DTC brands says a geo-holdout needs at least 20 matched market pairs, a control group with CTV paused or reduced by 50-80%, 6-12 weeks minimum, and typically $100K or more in monthly spend for statistical power (Attn, secondary). It adds that DTC brands spending $50K+ monthly on CTV need to prove incrementality. Those thresholds are far above a neighborhood business, so small advertisers should adapt the logic (on-off periods, city comparisons) and accept weaker evidence.
Reported adoption of measurement approaches (different populations, see caption)
IAB via Adwave (2023, 2025), Snapchat-commissioned study via StackAdapt (2024), eMarketer via StackAdapt (incrementality), IAB via StackAdapt (AI measurement). All secondary; samples are large advertisers and are not small-business samples.
72%
Most connected TV advertisers now report using multi-touch attribution models, up from 48% in 2023
IAB 2025 Measurement and Attribution Report as quoted by Adwave. Respondents are CTV advertisers, not local businesses.
Adwave (secondary)
The same data shows why last click persists: 78.4% of respondents in a 2024 Snapchat-commissioned study used it to gauge media effectiveness (StackAdapt, secondary). A Google-cited study in the same article found a unified measurement approach produced a 40% increase in expected uplift compared with MTA alone. The conclusion is not "MTA is wrong". It is "MTA works best next to other methods". More on mixing methods is in advertising effectiveness measurement for small business.
Which method should a small advertiser use at each budget?
No source prescribes budget thresholds for local businesses. The table below is a decision aid built from the facts above, with the tiers themselves being assumptions for planning, not findings. Budget figures in the first column are monthly ad spend.
All of the above, plus a monthly GA4 last-click vs data-driven comparison
On-off test in one channel; spreadsheet path review
MMM
$5,000 to $25,000
Path-level export and a linear or position-based comparison
Time-window checks by product, simple city or ZIP test
Full MMM
Above $25,000
Dedicated attribution tool plus regular incrementality tests
MMM if long daily sales history exists
Relying on any one model
Even the lowest tier can use several channels. Adwave (secondary) says campaigns covering TV, Google Search, Facebook and Instagram start at $30 a day from a prepaid wallet, which is $900 over 30 active days per its published table. A budget that low can span channels, yet not generate enough conversions for model comparisons. The reasoning is in the local marketing budget guide.
Do not buy a model before fixing the inputs
A path model fed with untagged links, missing offline outcomes and unreconciled platforms redistributes bad data. Fix UTM tags, key events and the offline feedback loop first. The tool comes after.
What does a worked example look like for a fitness studio?
All inputs below are assumptions. They are not benchmarks. The point is to show how the same sales produce different channel credit under different models.
Assumptions: a boutique fitness studio records 100 trial sign-ups in a month (assumption). Three channels touch customers: Instagram ads, Google Business Profile views (map listing) and Google search ads. Monthly Instagram spend is $1,200 (assumption). Paths among the 100 sign-ups (assumption):
40: Instagram ad, then search ad
30: Instagram ad, then Business Profile, then search ad
20: search ad only
10: Business Profile only
Credit rules (assumption): linear splits equally; position-based gives 40% to first and last touch and 20% to the middle one, and splits two-touch paths 50/50; time decay weights touches 1:2 on two-touch paths and 1:2:4 on three-touch paths.
Model
Instagram
Business Profile
Search ads
First touch
70.0
10.0
20.0
Last touch
0.0
10.0
90.0
Linear
30.0
20.0
50.0
Position-based
32.0
16.0
52.0
Time decay
17.6
18.6
63.8
Values are credited sign-ups out of 100 (assumption). No data-driven row appears, since that model needs real path data to learn weights.
Credit for 100 sign-ups by model, fitness studio (assumption)
First touch
70%
10%
20%
Last touch
10%
90%
Linear
30%
20%
50%
Position-based
32%
16%
52%
Time decay
18%
19%
64%
Instagram (70)
Business Profile (10)
Search ads (20)
Assumed paths for one month and assumed credit rules. Illustrative arithmetic, not studio data.
The same Instagram spend looks very different. Under first touch it gets 70 sign-ups, under last touch none. Dividing the assumed $1,200 by the credit gives the implied cost per credited sign-up.
Implied Instagram cost per credited sign-up in dollars (assumption)
Assumed $1,200 spend divided by assumed credit from the table. Last touch gives Instagram zero credit, so no cost can be computed.
One decision shows why this matters. Under last touch, Instagram appears worthless and a budget cut looks rational. Under first touch, it looks like the best channel. Both views are distortions of the same 100 sign-ups. A sensible reading is a range of $17 to $68 per sign-up, and the next step is a test: pause Instagram in a comparable period and watch whether search-ad sign-ups fall too. That is the logic behind A/B testing for local business.
What are the limits and pitfalls of multi-touch attribution?
Several pitfalls recur, and most come from treating credit as proof.
Credit is not cause. StackAdapt notes propensity is not incrementality: someone can be very likely to convert even if ads made no difference (StackAdapt, secondary). Retargeting often touches people who were going to book anyway.
Models disagree. Fifty-five percent of advertisers see conflicting results across tools (Kantar via StackAdapt, secondary). Disagreement is normal and should lead to a test, not a search for the "right" model.
Windows hide results. A 7-day reattribution period in GA4 data-driven attribution means recent figures can shift.
Direct traffic gets no credit in GA4, so branded demand created by other channels is attributed elsewhere.
Offline outcomes are invisible unless imported. A walk-in booking after an ad is a lost touch.
Vendor statistics skew promotional. Some claims in this article's sources have no named origin, for example the 287% purchase-rate claim for customers engaging across three or more channels (Adwave, secondary, no source named). Such numbers are best read as marketing copy.
IAB research cited by StackAdapt says up to 75% of marketers believe leading advanced measurement approaches fall short on rigor, timeliness, trust and efficiency. If the industry's own marketers are dissatisfied, a small business should keep expectations modest and avoid betting the budget on a single dashboard.
78.4%
Last click remains the default yardstick for most advertisers, even as multi-touch grows
2024 study commissioned by Snapchat, as cited by StackAdapt. Sponsored research; treat as directional.
StackAdapt (secondary)
A second concern is sample size. Fewer than a few dozen conversions a month cannot support path comparisons, since a handful of journeys can swing credit by tens of percentage points. At that scale, direct customer feedback is more reliable.
How can promo codes, surveys, call tracking and geo tests fill the gaps?
These methods do not compete with MTA. They cover what it cannot see.
Promo codes and unique URLs attach a campaign to a sale at the moment of purchase. They suit offers that customers have a reason to redeem, such as a first-class code or a printed flyer. The limit is obvious: people who saw the ad and skipped the code vanish from the count.
A "how did you hear about us" field costs nothing and captures offline paths. Its answers favor memorable touches, so use it as a second opinion next to the digital data. Splitting the options into specific choices (Instagram, Google search, friend, passing the studio, flyer) works better than free text for counting. The cumulative size of the answer pool matters for reliability:
Months to collect 100 survey answers at two response rates (assumption)
Assumed response rates: a business that gathers 15 answers per month needs about seven months to reach 100, and one gathering 30 needs about four. The 100-answer minimum is an assumption for a rough read, not a statistical rule.
Call tracking assigns a number per source, so phone leads can be tied to a channel and, with call recording or notes, to outcomes. It matters most for salons, groomers and service trades where booking happens by phone. See the call tracking comparison.
Geo tests and on-off pauses measure cause rather than credit. Run the ads in some areas or weeks and not others, then compare sales. The DTC guide's design (matched pairs, a 50-80% reduction in the control group, at least 6-12 weeks, p-value below 0.05) is a large-scale template (Attn, secondary). A local version is smaller and noisier. Before pausing anything permanently, consult when to pause an ad campaign.
How should each type of local business apply this?
The logic differs by how customers decide and where they convert.
Coffee shop. Purchases are frequent and low-ticket, and the path is short. Attribution software is overkill. A hyper-local social ad (the Adwave example, secondary, is ads for a new fall latte to everyone within a five-mile radius) can be tracked with a menu-specific code or a "show this screen" offer, plus a till-prompt question. Watch redemptions per week before and after the ad.
Hair or beauty salon. Bookings come through an online scheduler and the phone. Track online bookings by UTM source, use a tracking number on the Google listing and add a required "how did you find us" field at booking. Reviews also matter as a touch; see review management software. A formula model adds little at under a few dozen bookings a month.
Pet groomer. Repeat clients drive revenue, so attribute the first booking only. Use a "new client" tag in the booking system, plus a referral code for word of mouth. Local search is the main discovery path, which makes local SEO results worth comparing against paid sources.
Fitness studio. Trials, intro offers and memberships create a funnel with measurable stages. This is the first type where path analysis is useful, as the worked example showed: Instagram, Google listing and search can all touch a prospect. Track trial sign-up, show-up and conversion to membership as separate events, since the lead-generation events in GA4 were designed for offline conversion stages (Google Analytics Help).
Startup. Journeys are longer and more channels run in parallel, so a startup is the best candidate for a path model. The caution is volume: early on, conversion counts are small. Start with first and last touch side by side, add data-driven in GA4 once volume grows, and run a pause test on the largest line item. The same discipline applies to leads, covered in the local lead generation guide.
What is a 90-day plan for getting multi-touch attribution working?
The plan below sequences foundations before models. Time estimates are planning assumptions.
Days
Focus
Actions
Output
1-14
Define conversions
List the true business outcomes (booking, paid trial, sale). Mark GA4 key events. Set the property-level Marketer role holder.
Written conversion list
1-14
Tag everything
Standard UTM scheme for every ad, email and link; unique phone numbers for main sources
Tag guide and tracking numbers
15-30
Capture offline data
Add the "how did you hear" field at booking and till; start a promo code per channel
Weekly response log
31-45
Reconcile
Compare ad platform claims, GA4 and the booking system for one month
A single reference number for total conversions
46-60
Compare models
In GA4 compare data-driven with the two last-click models; rebuild linear and position-based in a spreadsheet using exported paths
A credit-shift table like the one above
61-75
Test cause
Pause or reduce one channel in a comparable period, or run it in one area only
Result note with sales change
76-90
Decide
Move budget in small steps, record the rationale and set the next test
One-page budget review
Keep to a rule: move no more than a modest share of budget on any model alone, and write down the other signals that agree or disagree. The multi-channel advertising guide covers how to stage changes across channels.
If Performance Max is in the mix, its reporting is a platform view of its own; see the Performance Max guide for how to read it next to GA4.
Which metrics should a small business track every month?
A tracker should show where the models agree as much as where they differ. Suggested monthly columns:
Metric
Why it matters
Source
Total conversions (reference)
Anchors every channel claim
Booking system or POS
Platform-claimed conversions per channel
Shows overlap against the reference
Ad platforms
GA4 conversions, data-driven vs last click
Reveals which channels are undercredited in last click
GA4 Attribution reports
Credit by model, 3 channels or more
Shows the range of plausible credit
Spreadsheet
Cost per conversion by model, as a range
Prevents single-number decisions
Spend and credit
Share of conversions from untracked sources
Shows blind spots (walk-ins, referrals)
How-did-you-hear field
Phone leads by source
Captures calls the web misses
Call tracking
Promo code redemptions
Direct campaign-to-sale link
POS or booking system
Time from first touch to conversion
Sets the right window
Path export
Result of last pause or geo test
Evidence about cause
Test log
The most useful single view is the range. If a channel's cost per conversion is acceptable under every model, scale it. If acceptable only under one model, test before spending more. According to EMARKETER, as cited by StackAdapt (secondary), more than one-fifth of US advertisers update their ad spend at least twice a month based on measurement data. A monthly review is a reasonable pace for a small team; the frequency should follow the number of conversions available, not a vendor's refresh rate.
What this guide cannot tell you
Several things are outside what the sources support.
No source here gives conversion rates, cost per lead or typical credit splits for coffee shops, salons, groomers or fitness studios. The studio example uses assumed inputs only.
The sources do not say which model is "best" for a small business. They describe how models work and where each fails.
GA4 behavior is documented only as far as the cited help pages. Any change after the opening date, or settings in a specific property, may differ.
Most statistics on adoption and measurement trouble come from vendor blogs repeating third-party studies (eMarketer, Kantar, IAB, Branch). Original methodologies and samples were not available, and respondents are mostly larger advertisers.
Thresholds for geo tests and MMM come from a DTC CTV vendor guide aimed at brands spending $50K+ monthly. They do not describe what a neighborhood business can achieve.
Match rates for cross-device identity are one vendor's typical ranges, not audited figures.
The budget tiers in the decision table are planning assumptions, not research findings.
Whether any model will improve return on ad spend for a given business is unknown without testing. No source here proves that adopting MTA raises sales.
FAQ
What is the difference between single-touch and multi-touch attribution?
Single-touch models, such as first touch and last touch, give all credit to one interaction. Multi-touch models, such as linear, time decay, position-based and data-driven, spread credit across several. According to StackAdapt (secondary), these two groups cover generally all marketing attribution models.
Can GA4 do linear, time decay or position-based attribution?
Not in its Attribution reports. Google's help page states that first click, linear, time decay and position-based models were no longer available as of November 2023, leaving data-driven, paid and organic last click, and Google paid channels last click (Google Analytics Help). Those other views can be rebuilt manually from exported path data.
Why does GA4 give no credit to direct visits?
All GA4 attribution models exclude direct visits from receiving credit, unless the whole path to the key event consists of direct visits (Google Analytics Help). The credit goes to the earlier tracked channel instead. For a local business with word-of-mouth demand, a direct-heavy path will therefore be partly invisible.
How many conversions are needed before multi-touch attribution is worth using?
None of the sources give a minimum for small businesses. The logic is that very small counts make credit swing widely, so path models add little. GA4's data-driven model depends on data availability and uses aggregate data from Data sharing settings where needed (Google Analytics Help). Below that volume, promo codes and surveys are more dependable.
Is last-click attribution still useful?
Yes, within limits. StackAdapt says last-touch reporting can help teams understand the final interaction before conversion (StackAdapt, secondary). It tends to undercount upper-funnel channels such as TV (Adwave, secondary), so compare it with at least one other view.
Should a small business use MTA or marketing mix modeling?
For most small advertisers, neither at first. StackAdapt suggests MMM for higher-level planning and budget allocation when user-level tracking is limited, and MTA for directional optimization (StackAdapt, secondary). One guide says MMM needs 2+ years of daily sales data (Attn, secondary), which many local businesses lack. A data audit shows which is feasible; a free audit or the analytics service can help set up the inputs.
Local marketing strategist with 10+ years at global agencies — OMD, Dentsu, GroupM, and BBDO. Now helping small businesses get the same data-driven edge. Based in Europe, working with clients in the US, UK, Australia, and beyond.