November 14, 2026·Nataliia Rumiantsewa· 24 min read All posts
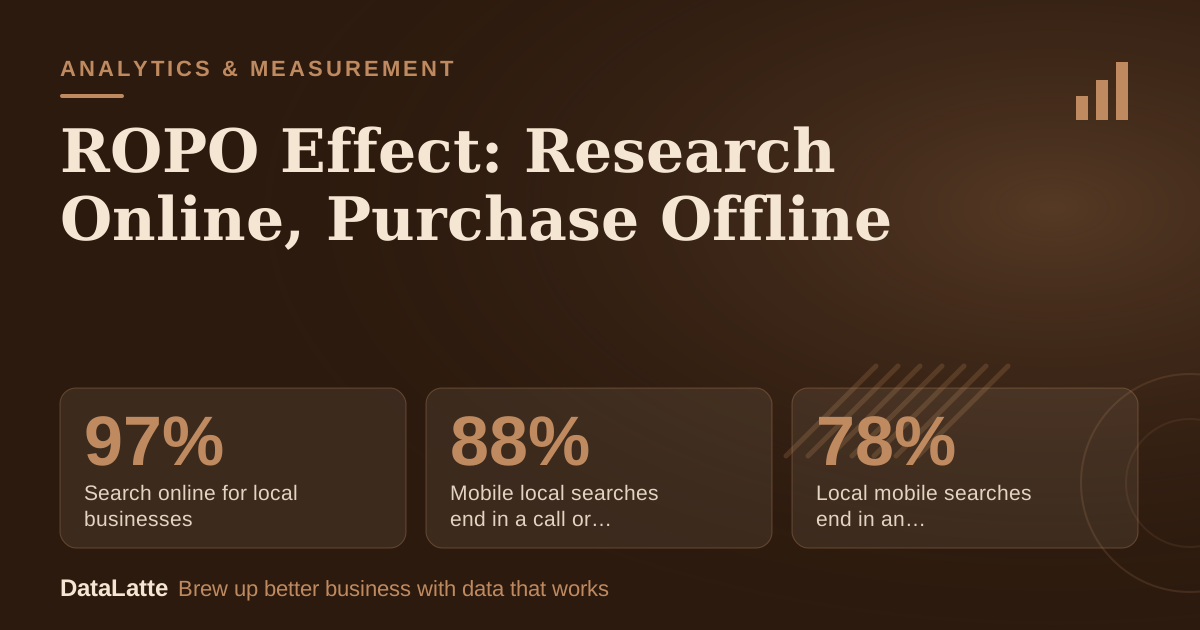
The ROPO effect (research online, purchase offline) describes shoppers who look a business up on a phone or computer and then buy in person, by phone or by booking a visit. One vendor-cited figure says 59% of consumers use Google to research a purchase they plan to make in-store or locally (secondary). For a local business, the sale often happens offline, so the online part of the journey is easy to miss and easy to under-invest in.
97%→
Search online for local businesses
Google insights via Contractor Marketing Pros (secondary)
88%↑
Mobile local searches end in a call or visit within a day
HubSpot blog (secondary)
78%↑
Local mobile searches end in an offline purchase
Google insights via Contractor Marketing Pros (secondary)
75%→
Read at least four reviews
Rio SEO via Adwave (secondary)
See Sources at the end of the article. Cards marked Assumption are examples, not results.
This analysis pulls together what the available sources say about how common research-first shopping is, what shoppers want to know before they walk in, how a small business gets found and chosen, and how to measure results when the checkout is a till, a phone call or a booking made at the front desk. Most figures come from vendors and blogs that retell larger studies, so each is flagged as secondary and treated as directional.
Six in ten consumers use Google to research a purchase they plan to make in-store or locally
Figure attributed to RightChoice.ai by a vendor article; the underlying study was not available for review.
Adwave, citing RightChoice.ai (secondary)
What is the ROPO effect and how does it differ from webrooming?
ROPO is the pattern of researching online and completing the purchase offline. Webrooming is the shopper-side word for the same behavior: browsing on the web, then buying in a shop. The reverse, showrooming, means inspecting a product in a store and buying it online. For a salon, groomer or coffee shop, "purchase" may be a booking confirmed by phone or a walk-in, not a product on a shelf.
A related term in the sources is Online to Offline. A Brazilian marketing agency describes it as a journey that attracts customers online and leads them to the physical store (secondary), and suggests tactics such as discount coupons redeemable only in-store or pickup at the physical location. ROPO observes the behavior; Online to Offline designs for it.
The measurement problem is simple. A shopper reads reviews on a phone on Tuesday, taps a phone number on Wednesday and pays at the counter on Saturday. Web analytics sees at most one session. The till sees a sale with no origin. Closing that gap is the purpose of the rest of this guide, and the same logic runs through footfall attribution for local stores.
How often do shoppers research online before buying in person?
The sources do not offer one clean, audited rate for "research online, buy offline" across US shoppers. What exists is a set of overlapping figures with different bases: all consumers, mobile searchers, people who searched in the last three months. The chart below lines them up so the differences stay visible rather than blended into a single headline.
Local search and research behaviors, share of consumers (different bases)
Search online for local businesses
97%
Read reviews before choosing a local service business
87%
Searched for a local business in past 3 months
84%
Read at least four reviews before deciding
75%
Use Google to research an in-store purchase
59%
Default to Google for local searches
45%
Each bar has its own base and source (Google insights via Contractor Marketing Pros, BrightLocal via Adwave and a vendor article, Rio SEO via Adwave, RightChoice.ai via Adwave). All secondary; compare ranks, not exact gaps.
Two points follow. First, the broad figure (97%) describes searching for local businesses at all, not a purchase journey. Second, narrower figures (59% researching an in-store purchase) are more useful for planning because they name the offline outcome. The BrightLocal-derived data cited by Adwave (secondary) also says 84% searched for a local business in the past 3 months and 45% default to Google for local searches.
The channel mix is moving too. In a 2024 survey of 7,861 adults by the NRF and Prosper, 44% planned to shop both in-store and online on Super Saturday, up from 41% a year earlier, while 31% expected to shop only in-store (down from 37%) and 24% online only (up from 22%). That is a holiday-weekend snapshot, not a year-round rate, but it shows the mixed journey growing.
Planned Super Saturday shopping channel, prior year vs 2024 (share of respondents)
Prior year
41%
37%
22%
2024
44%
31%
24%
Both in-store and online (41)
In-store only (37)
Online only (22)
NRF and Prosper Insights survey of 7,861 adults, 2-9 December 2024, reported by Retail Dive. Holiday weekend only; shares do not cover other times of year.
44%
Nearly half of holiday shoppers planned to use both stores and websites, and the group grew in a year
Up from 41% the prior year, in a survey of 7,861 adults.
NRF and Prosper Insights via Retail Dive, December 2024
What happens within 24 hours of a local search?
A cluster of statistics describes how quickly a local search becomes action. They repeat across blogs, usually without a link to the original study, so the repetition should not be mistaken for independent confirmation. Still, the direction is consistent: local intent is time-sensitive.
Claim
Figure
Source type
Mobile searches for local businesses end in a call or visit within one day
The 78% and the 28% describe nearly the same thing, a local search ending in a purchase, and they differ by a factor of almost three. Differences in wording ("offline purchase" versus "purchase"), in base (mobile versus all local searches) and in year may explain it, but the sources do not say. Planning should treat the real figure as unknown and measure it locally.
What local searches lead to within about 24 hours (reported shares)
Reported by HubSpot's blog, Contractor Marketing Pros and Adwave, all secondary. Bases differ (mobile versus all local searches); the 28% is the most conservative figure.
Roughly one in four local searches ends in a purchase, according to Google data as retold by a vendor
The same source says 76% of local searchers visit a related business within 24 hours.
Adwave, citing Google internal data (2023), secondary
What do shoppers look for before they buy in person?
The sources point to a short list of questions: is the place open, is it trustworthy, how do I get there, can I afford it and do they have what I need. Hours, address, phone and photos are exactly the fields that Google Business Profile lets owners add (secondary), alongside user reviews and the service area. Local ad formats pull from the same profile: Google shows address, hours and reviews in local campaigns from the advertiser's profile (secondary).
Trust signals matter before the visit:
75% read at least four reviews before deciding (Rio SEO, as of 2025, secondary).
59% expect a response within 24 hours (same source).
53% say inaccurate listings drive them away (same source).
61% of mobile searchers are more likely to contact a business with a mobile-friendly site (secondary).
53%
More than half of consumers say inaccurate listings drive them away
Rio SEO figure as of 2025, retold by Adwave. A wrong hour or old address can end the journey before the visit.
Rio SEO via Adwave (secondary)
Which question should be answered where?
The following table maps typical pre-visit questions to the place where the answer is most likely to be read. The mapping itself is a recommendation built from the profile fields and ad features described in the sources, not a measured ranking.
Customer question
Best place to answer
Why this place
Are you open right now, and on holidays?
Google Business Profile hours, special hours
Hours appear in the profile and in local ads
How do I get there, where do I park?
Profile address, photos of entrance, directions button
Local campaigns optimize for directions requests
Can I call and get a quick answer?
Profile phone, mobile-friendly site with tap-to-call
Calls are a measured local action
Do you offer this service, and for how much?
Profile products and services, website price page
Descriptions allow up to 1,000 characters
Are you any good?
Reviews with owner replies
Four or more reviews are read before deciding
Is it in stock today?
Profile product listings, an updated page, social post
Listings should be updated when items are removed
Is there a deal for first-time customers?
Offer button, email signup, in-store coupon
Coupons redeemable in-store link online to offline
Reported consumer behaviors that shape the pre-visit decision (share, %)
Each axis has its own base and secondary source, as listed in the article. Use as a map of where attention goes, not as one funnel.
How does a local business get found and chosen?
Being found and being chosen are two jobs. Found means appearing in Google Search and Maps for the searches near the business. Chosen means winning the comparison once a shopper sees three or four options side by side. The profile does both.
Is the Google Business Profile the main lever?
The vendor figure says 86% of Google Business Profile views come from discovery searches, like "dresses near me", not from people who already know the brand (secondary, no named source). If that holds even roughly, a complete profile is how strangers meet the business. The remaining 14% would be people searching the name directly.
Where Google Business Profile views come from
Discovery searches86%86%
Brand-name searches (remainder)14%14%
Vendor figure, no named source (Adwave, secondary). The 14% is the arithmetic remainder, not a separate reported number.
The same article states that for service businesses, clicks-to-call can account for 10% to 15% of all profile views (secondary), and illustrates that with around 50 calls a month. That is an illustrative estimate, not a benchmark for every trade. For a deeper treatment of ranking factors, see the guide to SEO for local service businesses.
Why do reviews and listing accuracy decide the choice?
Review volume and replies are signals shoppers read. With 75% reading at least four reviews (secondary) and 59% expecting a reply within 24 hours, a profile with two reviews and silence loses to a rival with sixty and visible owner replies. Tools that automate requests are compared in the review management software guide.
Accuracy is the cheapest fix. Only 28% of small businesses invest in online listings according to LocaliQ as cited by HubSpot (secondary), which means a business that keeps its name, address, phone and hours consistent is ahead of most competitors by default. The same vendor recommends reviewing the full product and service list at least once a quarter and updating the profile whenever a service is added, a price changes or an item is removed.
75%
Three in four consumers read at least four reviews before deciding
Rio SEO figure as of 2025, retold by Adwave; 59% also expect a reply within 24 hours.
Rio SEO via Adwave (secondary)
How much content does the profile need?
One vendor playbook suggests posting a Google Business Profile update twice weekly, with three supporting posts per anchor asset (a profile update, an Instagram Reel and an email snippet) and a weekly review kept to thirty minutes (secondary). Treat that as a workload template rather than proof that the cadence wins.
A field study reported by Website That Sell, also cited in that article, found businesses publishing 2 or more pages a month averaged 326% more traffic than those without a content strategy (secondary; method unknown). Emulent's directional benchmarks in the same article put local rankings at positions 15 to 30 in months 1 to 3, 5 to 15 in months 4 to 6, and 1 to 5 in months 7 to 12, with traffic growth moving from baseline to a 25% to 50% increase and later 100% or more.
Directional traffic growth benchmarks as a campaign matures (percent increase)
Emulent hyperlocal SEO framework as cited by Adwave (secondary). The source calls these directional; the stage mapping of each value is an interpretation of 'moving from baseline to 25% to 50%, reaching 100% or more'.
Which methods measure ROPO, and what does each need?
No single tool sees the whole journey. Measurement combines direct signals (calls, directions, coupon redemptions) with modeled ones (store visits) and with plain asking. The table compares the main methods on what each reports, what it needs and where it breaks.
Method
What it reports
Data and setup needed
Budget and skills
Main limit
Google Business Profile insights
Calls, direction requests, website clicks
Verified, complete profile
Free; basic admin skill
Counts actions, not sales
Call tracking numbers
Calls by source, sometimes recordings
Tracking numbers on site, profile and ads
Low to mid monthly fee; some setup
Number changes must stay consistent with listings
Store Visit Reports in Google Ads
Modeled visits from ad clicks
Linked, verified Business Profile; campaign and click thresholds
There is also a visibility threshold. The same page says Google only shows the metric when a location and campaign clear its privacy and click thresholds, without giving values. A single-site groomer with a small ad budget may see no store-visit data at all, which is a limit of the tool, not a sign that nobody visits.
The vendor says Google's local campaign guidance recommends tracking visits and conversions with Store Visit Reports (secondary). That is useful when volume suffices. When it does not, the lower-tech methods in the table (codes, a checkout question, call tracking) do the same job with less machinery.
Common pitfalls:
Counting profile clicks as customers; many callers never book.
Changing the phone number on one listing but not the others, which breaks consistency.
Treating a modeled visit figure as an exact count.
Running a promo code that staff forget to ask about.
Judging a month in isolation when the purchase cycle is weeks long.
The sources do not price a ROPO measurement stack, so tiers below are an assumption: the order is sensible, the dollar bands are not sourced. For spending context in another trade, one vendor says a single-location pest control company should expect to spend $1,500 to $5,000 per month on Google Ads depending on competitiveness (secondary), which shows how wide ad budgets can run.
If the budget is (assumption)
Use
Why
Time only, no spend
Complete Business Profile, review replies, checkout question, in-store code
Free signals cover the main ROPO questions
Small monthly fee
Add call tracking numbers and UTM links on the site
Separates profile, site and ad calls
Modest ad spend
Add Local Services Ads or search ads and watch profile actions
Pay per lead where available; see below
Larger ad spend with several locations
Add local campaigns and Store Visit Reports
Needs enough volume to clear thresholds
Any budget, after three months of data
Run a pause or geo test
Shows whether ads add visits beyond baseline
On lead pricing, Local Service Ads operate on a pay-per-lead model, where the advertiser pays when a customer makes direct contact (secondary), and the article lists eligible industries such as electricians, HVAC, plumbers and locksmiths as of 2026; pet grooming is not on that list. Pest control leads are quoted at $15 to $50 each versus $5 to $20 per click for standard search ads (WordStream 2024, secondary). Those prices belong to home-service trades and should not be carried over to a salon or café.
Warm leads from retargeting convert at two to three times the rate of cold traffic
Pest control vendor claim; not tested for other trades.
Adwave pest control guide (secondary)
What does a ROPO playbook look like by business type?
The playbooks below are recommendations assembled from the profile features, review behavior and measurement methods above. They are not tested results.
Coffee shop
Hours and holiday hours matter most, because "open now" searches are the likeliest trigger. Keep photos of the entrance and interior current, answer reviews within a day and post a profile update twice weekly with a seasonal drink or a weekday offer. Measure with direction requests, a counter code on a loyalty offer and a weekly tally of new customers who mention Google.
Salon
Services and prices are the research content. List each service with a short description in the profile, add a booking link and photos of finished work. Ask every new client how they found the salon at booking, and compare that tally with calls and booking-link clicks. First-visit offers can be redeemed at the chair, keeping the sale offline and the code traceable.
Pet groomer
The decision is trust: owners read reviews about how pets were treated. Photos of clean facilities and calm dogs, review replies and clear service lists by size or coat type answer the first questions. Calls are likely to be the main action, so call tracking is more informative than store-visit modeling. The worked example below sizes this.
Fitness studio
Prospects often compare several studios and want schedule, price and a trial. List class types and trial offers in the products and services fields, add a trial booking link and use an in-person trial pass with a unique code. Track trial sign-ups by source, then trial-to-member conversion at the front desk.
Startup with a physical launch
Without reviews or history, trust gaps are widest. Verify the profile before opening, collect early reviews from launch-week visitors and ask for consent-based email signups with a launch offer. The Brazilian agency article says email lists must come from customers providing their own address, not from bought or scraped lists (secondary). Test one paid channel only after the profile and review basics are in place; a testing routine is described in A/B testing for local business.
28%
Only a minority of small businesses invest in online listings, so accuracy alone can be a differentiator
LocaliQ figure as cited by HubSpot's blog, published January 2026.
HubSpot blog, citing LocaliQ (secondary)
What does a worked example look like for a pet groomer?
This model uses invented inputs, all labelled as assumption, to show how the measurement fits together. It is not a forecast and no input is a benchmark.
Inputs (assumption):
Profile views per month: 1,000 at baseline, 1,500 after three months of profile work.
Share of views that become calls: 8% at both points.
Share of calls that book: 40% at baseline, 45% after faster callbacks.
Share of views that tap directions: 4%; of those, 25% book or walk in.
Share of views that click to the website: 5%; of those, 20% book.
Average ticket: $70 per visit.
Baseline calculation (assumption): 80 calls, 32 bookings, $2,240 from calls; 40 direction taps, 10 visits, $700; 50 website clicks, 10 bookings, $700. Total monthly revenue traced to the profile: $3,640.
After three months (assumption): 120 calls, 54 bookings, $3,780; 60 direction taps, 15 visits, $1,050; 75 website clicks, 15 bookings, $1,050. Total: $5,880.
Monthly revenue traced to the Google profile by action, baseline vs month 3 (assumption)
From calls
From direction requests
From website clicks
1. Baseline (assumption)
3640
2. Month 3 (assumption)
5880
Review growth is part of the lift. Assuming the groomer starts with 80 reviews, the chart shows how the monthly collection rate changes the time needed to reach two levels (assumption).
Reviews over 12 months at two collection rates (assumption)
Two sourced numbers frame the example. Adwave's own illustration of a 10% to 15% click-to-call share and around 50 calls a month is the kind of estimate the model reproduces with different inputs. And the pest control article's point that a $250 first treatment can grow to $1,200 to $2,000 a year if converted to a recurring plan (secondary) is a reminder that, for repeat services, first-visit revenue understates customer value. A groomer with regular clients should track rebooking, not only the first booking.
What is a practical 90-day plan?
The plan sequences free fixes first, then measurement, then optional spend. It assumes a single-location business with no tracking in place.
Days
Focus
Actions
Output
1-7
Audit
Verify the profile; compare name, address, phone and hours across listings; note current reviews and rating
Clean listing baseline
8-14
Profile completion
Add services with descriptions, photos of at least 1200 by 900 pixels, booking link, special hours
Complete profile
15-30
Review habit
Ask each satisfied customer for a review; reply to all reviews within 24 hours
Review count and reply rate
15-30
Measurement basics
Add a "how did you hear about us" prompt; set up a unique in-store code; add UTM links to profile and site
First source tallies
31-45
Phone tracking
Add call tracking numbers on the site and ads, keep the main number on listings
Calls by source
31-60
Content cadence
Two profile updates a week; short weekly review limited to thirty minutes
Posting rhythm
46-60
GA4 events
Track phone taps, direction taps and booking clicks as events
Online step data
61-75
Optional paid test
One ad channel with a clear call or directions goal; link the profile for store-visit data if volume allows
First paid results
76-90
Review and decide
Compare sources, cost per booked customer and rebooking; keep, change or stop channels
No source here gives a verified, independent US rate for research-online-buy-offline across all shoppers. The most quoted figures are retold from Google or BrightLocal without links to original studies.
Several statistics (78%, 88%, 76%) overlap and conflict in definition; the 28% purchase figure suggests that the higher ones describe actions broader than a sale.
Vendor claims such as 86% of profile views from discovery searches and a 30% to 50% engagement lift from photos come without named studies.
Industry numbers on lead prices, cost per click and return on ad spend come from pest control and contractor trades, and may not apply to cafés, salons or studios.
The 2024 NRF and Prosper data covers a holiday weekend and says nothing about ordinary weeks.
Store-visit modeling needs thresholds the sources do not quantify, so a small business cannot know in advance whether it will see data.
The worked example uses assumed inputs; it shows method, not expected results.
FAQ
Is ROPO the same as webrooming?
Nearly. Both describe researching online and buying in person. ROPO is often used by marketers measuring the journey, while webrooming describes shopper behavior. In services, the "purchase" may be a booking by phone or an appointment kept at the premises.
How many shoppers research online before buying locally?
The sources give different figures with different bases: 97% search online for local businesses and 59% use Google to research purchases planned in-store or locally, both retold by vendors (secondary). No source here gives one audited rate, so a local check using a checkout question is more reliable.
Can a small business see store visits?
Only in modeled form. Google Ads reports store visits as estimates extrapolated from a sample at the campaign level, and it requires a linked, verified profile and enough volume to pass privacy and click thresholds (agency guide, secondary). Calls, directions, codes and checkout questions work at any size.
What is the cheapest way to start measuring?
Complete the Google Business Profile, read its call and direction counts weekly, ask new customers how they found the business and use one unique in-store code. These cost staff time rather than money and cover the main ROPO signals.
Do reviews really affect offline sales?
The sources show that reviews are read before choosing: 87% read reviews before choosing a local service business and 75% read at least four (secondary). They do not isolate a sales effect, so tracking calls and bookings before and after a review push is the local test.
How often should the profile be updated?
One vendor suggests profile updates twice weekly and a full product and service review at least quarterly, plus an update whenever a service, price or availability changes. These are recommendations, not proven optimal rates.
Measurement of this kind is easier with a second pair of eyes on the setup. A free audit reviews profile, tracking and call data, and the analytics service covers building the full dashboard.
Local marketing strategist with 10+ years at global agencies — OMD, Dentsu, GroupM, and BBDO. Now helping small businesses get the same data-driven edge. Based in Europe, working with clients in the US, UK, Australia, and beyond.