Online-to-Offline (O2O) Marketing for Local Business
November 14, 2026·Nataliia Rumiantsewa· 24 min read All posts
Online-to-offline (O2O) marketing uses online channels such as search, maps, social, email and ads to bring people into a physical location, onto a phone call or into a booking. One Shopify guide (secondary) defines the local version as using online channels to drive foot traffic to a retail store. The hard part is not the channels. It is proving that a visit followed the click, and knowing where that proof stops.
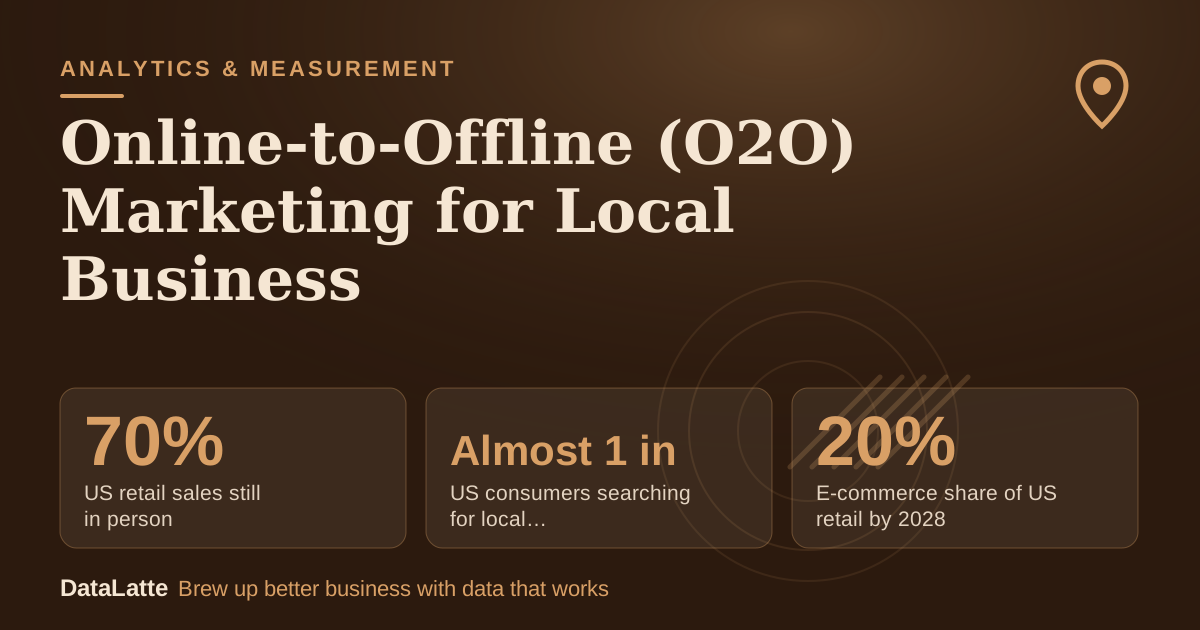
70%→
US retail sales still in person
NRF, via StackAdapt (secondary)
Almost 1 in 3→
US consumers searching for local businesses daily
BrightLocal, via Shopify (secondary)
20%↑
E-commerce share of US retail by 2028
EMARKETER, via StackAdapt (secondary)
5-10%→
Revenue small businesses typically spend on marketing
Adwave (secondary)
See Sources at the end of the article. Cards marked Assumption are examples, not results.
This analysis covers what O2O is, which channels carry it, how store visits and foot traffic are measured, what limits that measurement, how privacy shapes it, and how to build a plan. A coffee shop worked example uses clearly labelled assumptions, and the closing sections give a 90-day plan and a tracker.
A free Google Business Profile is the base layer, but Google's guidelines restrict it to businesses with a physical location customers can visit, or that travel to customers.
Streaming TV is not judged by clicks. Adwave's CTV guide (secondary) says advertisers look for later actions such as website visits, branded search, lead volume or store traffic.
Performance Max has volume needs. One vendor checklist (secondary) suggests skipping it with fewer than about 15 reliable conversions a month.
Brand and performance spend work together. Adwave (secondary) suggests an 80/20 or 70/30 split favoring performance for startups and small businesses, with 20-30% held for brand.
70%
Most retail sales still happen face to face, so the store is where online effort has to pay off
NRF figure on the share of US retail sales occurring in person, cited by StackAdapt.
NRF via StackAdapt retail marketing blog (secondary)
What is online-to-offline marketing?
O2O marketing is a journey that tries to attract customers online and lead them to the physical business. A Brazilian agency article (Eficaz Marketing, secondary) describes it in exactly those terms and suggests two simple mechanics: discount coupons that can only be redeemed in the store, and pickup of products at the physical location.
The definition has three parts. An online touchpoint creates intent: a search, a map listing, a social post, an email, an ad. A bridge turns intent into an action: directions, a call, a booking, a coupon, a QR scan. An offline outcome closes the loop: a visit, a purchase, a repeat visit. Each part can be measured, but the measurement gets weaker the further it moves from a screen.
A business can fail at any of the three. A strong ad that lands on a page with no hours, no address and no phone number breaks the bridge. A perfect listing that nobody sees breaks the first step. A busy store that cannot say where customers heard about it breaks the third, which is the most common failure for small local businesses.
O2O differs from general digital marketing in what counts as a result. A click or a view is an intermediate signal. The result is a person in the room, a call that ends in an appointment, or a transaction at the register. Everything in this guide is organised around that distinction.
The word "local" matters too. Radius, hours, parking, neighbourhood and competitors all shape the outcome. An Adwave guide (secondary) advises a geotargeting radius of 3-5 miles for most retail stores and 1-3 miles for restaurants, which shows how small the realistic catchment is compared with national campaigns.
Why does O2O matter when e-commerce keeps growing?
Because the growth of online sales has not removed the store. StackAdapt, citing EMARKETER (secondary), says US e-commerce was projected to reach nearly $1.5 trillion in 2024 and to account for 20% of total US retail sales by 2028. The same page, citing NRF, says 70% of retail sales still occur in person. Forrester, cited by StackAdapt's footfall article (secondary), predicts e-commerce will represent 24% of global retail sales by 2028.
Share of retail sales by channel, US and global
Figures as cited by StackAdapt; the two e-commerce values are forecasts for 2028, not measurements. Sources: StackAdapt retail and footfall blog posts (secondary).
The numbers describe different bases and years, so they are not additive. They still agree on direction: the share going online is rising and the store keeps a large majority of US retail activity. A forecast is not a fact about the future. The practical reading is narrower: for the foreseeable planning horizon of a single business, the store, salon or studio remains where most revenue is made.
Demand also starts online. The BrightLocal figure cited by Shopify (secondary) says almost a third of US consumers search for local businesses daily. A business can be excellent in person and still lose the visit because it is hard to find, shows wrong hours or has no reviews.
The marketing budget available to do this is usually small. Adwave (secondary) states that most small businesses allocate only 5-10% of revenue to marketing. At that level, wasted spend is expensive, so measurement quality matters more than channel count. See the local marketing budget guide for ways to size that figure.
Almost 1 in 3
Nearly a third of US consumers look up local businesses online every single day
BrightLocal finding as cited by Shopify; the page does not give the sample size in the excerpt used here.
BrightLocal via Shopify local online marketing guide (secondary)
Which online channels bring people to a store, a call or a booking?
Each channel does a different job in the journey. Search and maps catch people who already want something nearby. Ads create or capture that intent faster. Social and email keep existing customers returning. Codes and coupons link an online action to a counter transaction. Connected TV adds reach at the top of the funnel, which makes it harder to measure at the door.
Local search and maps. These capture high-intent demand. The listing is the product: name, category, hours, photos, reviews, products or menu. The next section covers the rules. The SEO guide for local service businesses goes further into organic visibility.
Social. Social platforms rarely capture intent but keep a business visible. The Eficaz article (secondary) cites a report counting more than 171 million social media users in Brazil, which shows scale in that market but says nothing about US local conversion. For US businesses, the practical use is offers, events and proof of experience that lead to a visit.
Email. The same article states that email lists must be built with consent from customers, not bought or scraped, and that discounts or rich content can be offered in exchange for email addresses. A list built at the counter and used for in-store offers is the cleanest O2O loop for a small business.
SMS. The sources used here do not cover text message rules or performance. Treat it as a channel that needs its own consent and legal check before use.
QR codes and coupons. The bridge from print or window to a trackable online action. An Adwave guide (secondary) offers illustrative in-store-only promotions such as 20% off when shopping in-store, a free item on every 10th visit and a first-50-customers offer. These are examples, not statistics.
Connected TV.Adwave (secondary) describes common local targeting options as ZIP code targeting, radius targeting, demographic filtering and customer matching, and says campaigns can start at a $30/day budget. The vendor claims. No independent performance data is available in the material used here.
Editorial comparison of O2O channels, scores 1 to 5 (assumption: editorial judgement, not measured data)
Setup effort
Cash cost
Store-visit measurability
Speed to first result
Google Business Profile
2
1
3
3
Search and maps ads
3
4
4
5
Performance Max
4
4
4
3
Social posts and ads
3
3
2
3
Email
2
1
3
3
QR and coupons
2
1
4
4
Connected TV
3
5
2
2
Scores are an editorial assumption for a single-location US business, where 5 is the highest effort, cost, measurability or speed. They are not survey results.
The table above is an opinion, so adjust it to local conditions. A full comparison of methods follows later in this guide.
How does a Google Business Profile support O2O, and what are its rules?
A Business Profile is the most direct online-to-offline asset a local business can own. Google's guidelines state that a business may create one if it has a physical location customers can visit, or travels to customers where they are.
The guidelines also set limits that decide whether the asset exists at all. A P.O. box or a mailbox at a remote location is not acceptable as an address. A virtual office, where a business rents a mailing address but does not operate from it, is not eligible. A co-working office qualifies only if it keeps clear signage, receives customers during business hours and is staffed by business staff during those hours.
Several rules affect what can be written in the profile:
Only one profile per business, and Google advises against more than one page for each location, whether in one account or several.
The fewest categories that describe the core business, as specific as possible.
No links of any type in the business description, and no focus on special promotions, prices or sales.
No marketing taglines, store codes, trademark signs, fully capitalised words, hours, phone numbers, URLs, service information or location information in the business name. Unnecessary information in the name can lead to suspension.
No premium phone numbers, regardless of the rate charged to the caller.
A service business with separate locations, each with its own service area and separate staff, may have one profile per location.
Businesses whose products or services need a minimum customer age, such as alcohol, cannabis or weapons, cannot be service-area businesses without a storefront.
For restaurants with several sets of hours, the guidance is to use dine-in hours first, then takeout, then drive-through, and delivery as a last resort. If a mailbox or suite number must be given, the physical address goes in Address Line 1 and the suite or mailbox in Address Line 2.
Menus are another bridge. Google describes two kinds of menus: one for eating and drinking establishments and one for service businesses. A menu must list the complete set of items or services, not only "popular items", and menu URLs cannot be direct links to third-party ordering or delivery services.
Retailers in an eligible country (US, CA, UK and IE) can showcase in-store products on the profile to turn online searchers into in-store shoppers. Google does not allow in-store product content related to alcohol, tobacco, gambling, financial services, pharmaceuticals and unapproved supplements, or health or medical devices. Submitting violating products may remove the entire product catalog, including compliant items.
Practically, the profile is not a place for marketing copy. It is a place for accurate facts. The O2O work is to keep hours, categories, photos and menus correct, and to measure what the profile produces. Review volume and response also matter; see the guide on review management software for tools.
A business with no eligible physical presence cannot use this asset. Its O2O route then depends on other channels, and the local link building guide covers a complementary one.
1 profile
Google wants a single Business Profile per business so that Maps and Search information does not break
Guideline: only one profile per business; no more than one page per location.
Google Business Profile guidelines
How are store visits and foot traffic measured?
There are four layers of measurement. They differ in cost, precision and the claims they support.
Direct counts. A door counter, a point-of-sale transaction count or a booking system records what actually happened. These are the ground truth but do not say where the customer came from.
Self-reported source. A form field, a staff prompt ("How did you hear about us?") or a coupon code that is redeemed at the register. It is cheap and works at any budget, but relies on memory and staff discipline.
Platform-reported conversions. Ad platforms can report actions such as calls, directions and store visits. A vendor page (secondary) says Google's channel performance report includes offline conversions such as local actions, store visits and store sales, citing Google Ads Help. The same page says Google recommends store goals only for accounts eligible for store visits (per AdNabu).
Footfall attribution.StackAdapt (secondary) describes it as a method that connects in-store traffic to digital marketing campaigns. It is also called foot traffic attribution. According to the same page, footfall is measured by pseudonymously tracking signals from mobile devices and matching them to the ads customers saw. A second StackAdapt page (secondary) says it can be used to measure cost per store visit.
Footfall attribution estimates uplift. The vendor says it compares customers exposed to a campaign with a control group that did not see the ads. The difference is the incremental effect, and the exposed group's raw visit count is not the result. Visit rate, in the vendor's description, identifies the average daily visits by specific customer segments.
StackAdapt also says it uses verified third-party location partners that report on the actual devices that may have visited a location after seeing an ad, as well as projected future visits, with near-real-time reporting. Its solutions team says these measurement offerings are made possible through integrations with partners (secondary). The practical reading: a business buying this is buying a partner chain, not a single tool. Terms, panel size and minimum spend are not in the sources, so they should be asked of any provider.
For connected TV, Adwave (secondary) says clicks from the TV itself are not the yardstick. Its dashboard, per another Adwave page (secondary), tracks impressions (total times shown), reach (unique households) and frequency (the average times a household saw the ad). These describe exposure. Visits need a separate layer, which is why TV is covered in the guides on measuring CTV ads and cross-channel attribution with TV.
Which layer to use depends on volume and money. A single-location shop with a few hundred transactions a week does better with direct counts, coupon codes and a clear before-and-after window than with a footfall partner. For a deeper walk-through, see the guide to footfall attribution for local business and the general piece on advertising effectiveness measurement.
Control group
Footfall attribution measures uplift by comparing exposed customers with a control group that never saw the ads
Described by the vendor as the way it measures lift in visits.
What are the limits and pitfalls of store-visit measurement?
Several limits are stated or implied by the sources, and others follow from how the methods work.
Eligibility. The sources used here say Google recommends store goals only for accounts eligible for store visits, which means eligibility is not universal. The thresholds are not given in the material available, so any account should check its own eligibility inside the Google Ads account before planning on that metric.
Consent and signal coverage. The vendor says footfall data is obtained only after notice has been given, consent has been obtained and location sharing is enabled. Devices without that consent are invisible. A visit count is therefore a sample, not a census, and its coverage rate is not stated in the sources.
Modelled and projected figures. The vendor says its partners report on devices that "may have visited" a location and on projected future visits. "May have" and "projected" are the vendor's own wording, and they signal inference.
Attribution is not causation. A person who saw an ad and then entered the store might have come anyway. The control-group design exists to address this, and view-through versus click-through conversions covers the same issue for online conversions. Without a control, treat reported visits as an upper bound.
Confusing sessions with clicks and clicks with visits. Web analytics counts sessions, ad platforms count clicks, and the door counts people. Each is a different unit. The article on sessions versus clicks explains the first gap, and Google Analytics 4 for small business shows how to set up the web side.
Hypothetical lifts treated as benchmarks. The Adwave foot traffic page (secondary) says a new window display "might" increase foot traffic 10% and extended weekend hours "might" drive 20% more weekend visits. It frames both as hypotheticals. They are not data and should not be used as targets without a local test.
Mixed signals from several channels at once. Running ads, an email, a coupon and a window display in the same week makes any single lift impossible to isolate. Sequence changes, or use a holdout.
Calls. Phone calls are a real O2O outcome for service businesses, but a call is not a booking. The comparison in call tracking for small business covers tools and pitfalls.
A realistic position for a small business: use platform and footfall figures as directional, and anchor decisions to counts it controls: coupon redemptions, bookings, register transactions and a before-and-after calendar.
Marketing leaders on performance channels, DMEXCO survey of chief marketing officers
Figures as cited by Adwave from a DMEXCO survey of CMOs; the survey sample size is not given in the excerpt. Source: Adwave brand vs performance article (secondary).
What does privacy require for O2O measurement?
The sources are limited here and do not amount to legal guidance. Three statements are available.
First, StackAdapt (secondary) states that its footfall data is obtained only after notice has been given, consent has been obtained and location sharing is enabled. Second, it says footfall is measured by pseudonymously tracking signals from mobile devices. Third, the Eficaz article (secondary) states that email addresses must be supplied by customers and that lists must not be bought or scraped.
Google's profile guidelines add one more boundary: merchants may post their own contact information (social media handles, email, phone number) on their profile or in responses, but soliciting personal or confidential information is not allowed.
For a small business, these lead to workable habits:
Collect email at the counter or online with a plain statement of what will be sent, and keep the proof of when it was given.
Prefer measures that do not need personal data, such as aggregate door counts and anonymous coupon codes.
Ask any footfall or location vendor how consent is obtained, what is pseudonymised, and how long data is kept. The sources do not state retention periods.
Check state and federal rules for texts, calls and email. The sources used here do not describe them.
Contextual targeting, which StackAdapt (secondary) describes as placing ads on websites or apps by the content viewed rather than a user's browsing history or personal data, is one route that needs less personal data. Dynamic retargeting, by contrast, uses data from browsing behaviour, abandoned carts or previously viewed product pages. Neither is an O2O channel by itself, but the contrast shows the privacy trade-off in targeting.
Privacy rules vary and change. This guide does not replace advice from a qualified professional.
How should the budget split between brand and performance?
O2O sits between both camps. A coupon redeemed this week is performance. A neighbourhood that recognises the shop name before searching is brand. Adwave (secondary) defines brand marketing as a long-term play on emotional connection, awareness and loyalty, and performance marketing as targeting immediate, measurable actions such as clicks and sales. It lists search engine marketing, paid social, affiliate marketing and conversion-focused email as typical performance channels, and classic TV, PR, billboards and podcasts or video series as typical brand channels.
The page's budget advice is as follows. Startups and small businesses should begin with an 80/20 or 70/30 split favouring performance, keep 20-30% for brand building, and move toward 60/40 or even 50/50 as revenue flows more predictably. It adds that brand efforts typically take six months to several years before tangible shifts appear in perception, recall and organic interest, depending on industry competitiveness, consistency of investment and creative quality. This is vendor guidance, not a measured rule.
Adwave suggested performance and brand splits by stage
Starting split A
80%
20%
Starting split B
70%
30%
Maturing split A
60%
40%
Maturing split B
50%
50%
Performance (80)
Brand (20)
Each row sums to 100%. Splits are Adwave's recommendations for startups and small businesses (secondary), not measured outcomes.
The same page cites Nielsen data saying that for every quarter a brand goes dark on advertising it loses an average of 2% of its future revenue, and that a 1-point gain in brand metrics can lift sales by 1%. These are retellings of third-party research and the underlying study is not linked in the material used here. Reading them as precise effects on a single café would be a mistake. Their usable message is directional: stopping all visibility has a cost that never shows in this month's report.
The page also names two example measures: a 4:1 CLV-to-CAC ratio and a 30% increase in branded search queries. For a local business, branded search growth is a cheap brand proxy that can be tracked in Google's own tools. Cost per acquisition and return on ad spend, defined by the same page as the average cost of acquiring one new customer and as revenue returned per ad dollar, then cover the performance side. A brand lift study approach can fill the gap when the budget is large enough.
2%
Each quarter a brand goes dark on advertising, it loses about 2% of its future revenue, according to Nielsen data
Retold by Adwave; the original study is not linked in the page excerpt, so treat as an indication.
Nielsen data via Adwave brand vs performance article (secondary)
When does Performance Max make sense for an O2O goal?
Performance Max (PMax) is the Google campaign type that serves ads across Search, Display, YouTube, Discover, Gmail and Maps from one campaign, per a vendor article (secondary). For local businesses it can include store goals, but, as noted, Google recommends those only for accounts eligible for store visits.
The same page collects third-party rules of thumb on volume and budget. They differ, and the vendor treats them as guidance, not Google rules:
Store Growers: roughly 20 to 30 conversions a month per campaign.
Digital Marketing Knight: 15 to 50 conversions a month as a rule of thumb, and a budget of about 10 times the target cost per conversion per day.
Black Propeller: 50 or more conversions helps campaigns exit the learning phase faster.
Learning period estimates: 6 days to 6 weeks (SEOQuick), and 4 to 6 weeks (George Tsiros).
Store Growers also says to avoid PMax under roughly $1,000 a month in an e-commerce context.
George Tsiros reports that most accounts with poor results made structural changes in weeks two to three, which reset learning.
Monthly conversions suggested before running PMax, lower bound per source
Lower bound of each cited range or threshold. Vendor and third-party rules of thumb as retold by Biznex (secondary); not Google rules.
The vendor's own checklist asks whether the business can fund 4 to 6 weeks without cutting budget and can reach about 20 to 30 conversions a month. Its reading, which it labels an inference and not a Google rule, is that a budget unable to buy about 20 to 30 real leads a month means PMax will struggle to learn.
For a single-location shop, the implication is concrete. If a campaign cannot produce roughly 15 to 30 reliable conversions a month, the account may be better served by a simple local search campaign, a well-kept profile and low-cost tests. If a store sells in volume, PMax may be worth a controlled trial with a fixed learning period during which structure is not changed. The detailed Performance Max guide lists setup checks, and when to pause an ad campaign covers stopping rules.
Creative inputs also matter. The vendor page says Google lets advertisers write up to 15 headlines of 30 characters. That favours short, specific lines: a product, a place, a time.
20 to 30
A budget that cannot buy about 20 to 30 real leads a month may leave Performance Max unable to learn
The vendor labels this its own inference, not a Google rule.
Biznex Performance Max for a local business (secondary)
How large should the targeting radius be?
Local intent has a small physical range. The Adwave guide (secondary) advises a geotargeting radius of 3-5 miles for most retail stores and 1-3 miles for restaurants. It also says a streaming TV campaign can reach every household less than 10 miles from the store. These are vendor guidance, not measured travel behaviour.
Suggested upper limit of radius, miles
Restaurants
mi3
Most retail stores
mi5
Streaming TV reach claim (less than)
mi10
Upper end of each range as stated by Adwave (secondary). Restaurants 1-3 miles, retail stores 3-5 miles, streaming TV claim is households less than 10 miles from the store.
A radius is a hypothesis to test, not a fact. A coffee shop beside an office park draws on a different catchment than one on a residential street, and a salon with a loyal base may pull people from further away. Start with the lower range, check where converting customers actually live (postal codes from bookings or loyalty sign-ups), then widen only if the data supports it.
ZIP code targeting, radius targeting, demographic filtering and customer matching are the options the CTV article (secondary) lists for local reach. The first two are the cheap defaults; customer matching needs a consented list, as covered in the privacy section.
Two practical rules follow. Exclude areas where the shop cannot realistically serve customers, such as zones across a river or highway with no easy route. And keep the radius stable during a test, so that changes in results are not caused by changing the audience.
Which O2O method fits which need? A comparison
The table compares methods on what each needs, what it proves and where it fails. Everything marked with a source is taken from the cited page; other cells are general reasoning about the method.
Skill needs follow the same order. A profile, a coupon and an email list need basic writing and tidy records. Search ads and PMax need account management and conversion setup. Footfall and CTV need a vendor, a brief and a way to read lift. A business without any analytics skill should climb the list from the top, not the bottom.
Where methods sit on cost and measurability (assumption: editorial scores 1 to 5)
Scores are an editorial assumption for one US location, not measured data.
How does a coffee shop model the funnel? A worked example
All inputs below are assumptions for a single coffee shop. They are not benchmarks, and each should be replaced with the shop's own data.
Assumptions:
Monthly budget: $600, split across local ads, profile upkeep, print and QR, and loyalty tools.
Monthly profile views and ad impressions that reach the "click" stage: 4,000 (assumption).
Share of those people who take an action such as directions or a call: 8% (assumption), giving 320 actions.
Share of those actions that become a visit: 40% (assumption), giving 128 visits.
Average ticket on a first visit: $9 (assumption), giving $1,152.
Share of first-time visitors who join the loyalty list: 25% (assumption), giving 32 members.
Each member returns 3 more times at $9 (assumption), adding $864.
Assumed split of the $600 monthly budget (assumption)
Local search and maps ads50%50%
Profile photos and offer updates20%20%
Print and QR codes15%15%
Loyalty and email tools15%15%
Illustrative estimate. Actual results vary by market and business.
On those inputs, cost per visit is $600 divided by 128, about $4.69. First-visit revenue is $1,152, or about $1.92 per budget dollar. Adding the assumed repeat visits lifts revenue to $2,016, about $3.36 per dollar. These ratios ignore ingredient and labour costs, so they are revenue ratios, not profit.
The model also shows where to look first. If the 40% conversion from action to visit falls to 20%, visits halve to 64 and cost per visit doubles to about $9.38. A change in the middle of the funnel has the same effect as a change in spend. Check hours, photos and directions before raising budget.
Loyalty growth matters more over time. Two cases are modelled: 16 sign-ups a month (a weaker 12.5% conversion, assumption) and 32 a month (25%, assumption), against a goal of 250 members.
Loyalty members over 12 months at two sign-up rates (assumption)
At 32 a month, the shop passes 250 members in month 8. At 16 a month it reaches 192 by month 12 and misses the goal. The gap between the two lines is a counter script problem, not an advertising problem: asking every first-time customer to join costs nothing.
Coffee shop O2O readiness score before and after 90 days (assumption)
Profile complete
Offer and codes
Tracking set up
Reviews and replies
1. Before
20
2. After 90 days
60
The readiness chart is a simple self-audit with points the shop assigns itself. The scale and weights are an assumption, so compare before and after, not against other businesses.
If budget is X, which method should come first?
The tiers below are assumptions, not sourced thresholds. The only sourced budget anchors are Adwave's starting levels for CTV, $30 a day (secondary) and the page's claim of campaigns from $50 (secondary), plus the PMax guidance above. Daily $30 over a 30-day month would be $900, a simple multiplication, not a quoted price.
If monthly budget is (assumption)
Start with
Add next
Avoid for now
Under $300
Complete Business Profile, review requests, in-store coupon code, email at the counter
Printed QR code to a booking or menu page
Performance Max, footfall vendors, CTV
$300 to $900
The above plus a small local search campaign with call and direction goals
Simple holdout test: ads off in one week
Several platforms at once
$900 to $2,500
Search plus a tested PMax trial if conversions can reach about 15 to 30 a month
Brand layer: social posts, local press
Changing PMax structure in weeks two to three
Above $2,500
CTV trial with ZIP or radius targeting and a measured control
Footfall attribution partner with consent terms checked
Judging CTV by clicks
Where two methods compete, keep the cheaper and more measurable one. A small business gains little from spreading a limited budget across five channels, none of which reaches enough volume to learn. See multi-channel advertising for local business for how to stage channels, and the A/B testing guide for how to run clean comparisons.
What does the playbook look like by business type?
Each playbook uses the same pattern: a profile that is accurate, one conversion that counts, and one offline signal the business already owns.
Coffee shop. Profile first: dine-in hours should lead if the shop has several sets of hours, per Google's restaurant guidance. Use a complete menu, not a "popular items" list, and do not link directly to a third-party ordering service as the menu URL. Offline signal: register counts by daypart. Add a counter email prompt and a loyalty reward, such as the illustrative free item on every 10th visit from Adwave's page (secondary). Radius: 1-3 miles for restaurants as a starting point on that page.
Salon. Bookings are the outcome. Make sure the booking link, services and hours are on the profile, and track calls separately from online bookings. A first-visit offer with a code redeemed at the chair gives a clean count. The risk is overlap: staff may use the code for people who would have booked anyway, so check redemptions against new-client counts.
Pet groomer. Many groomers travel to customers, which the profile guidelines allow if the business travels to customers where they are. A service-area setup still needs accurate service areas. Phone calls matter, so use the guidance in call tracking for small business, and keep premium numbers off the profile. Reviews with photos add proof.
Fitness studio. Trial class bookings are the measurable bridge. Use a trial offer code, and compare trial signups with membership starts at 30 and 60 days (assumption: the studio chooses the windows). Footfall attribution is less useful at low volume, because a studio with a small trial count cannot support a control group.
Startup with a single flagship store. Awareness is the problem, and the brand layer matters. Adwave's advice is to keep 20-30% for brand building even when performance leads. Keep one performance channel and one brand channel running long enough to read, since brand effects take six months to several years (secondary) according to that source. Use branded search growth and walk-in counts as the two core signals.
For a retailer with products on shelves, the profile's in-store product feature, limited to the US, Canada, UK and Ireland, may turn searchers into shoppers. Regulated categories are excluded, and a policy violation may remove the whole catalog.
3-5 miles
For most retail stores, a geotargeting radius of 3-5 miles works well; for restaurants, 1-3 miles may fit better
Vendor guidance, to be tested against where real customers live.
Adwave increase foot traffic guide (secondary)
What does a 90-day plan look like?
The plan assumes a single location and a budget under the middle tiers above. Each block should end with a decision, not just a report.
Days
Focus
Actions
Decision at the end
1-14
Foundations
Audit the profile against Google's guidelines: name, categories, address, hours, menu or products. Set a baseline of door or register counts. Add a source question or code at the register
Is the baseline reliable enough to compare against?
15-30
First bridge
Add QR codes or booking links to the profile and print. Start an email list with a consent statement. Ask for reviews
Are codes redeemed and sign-ups growing?
31-45
Paid test
Launch a small local search campaign with call and direction goals. Hold the radius fixed
Cost per call or direction acceptable?
46-60
Offer test
Test one in-store-only offer against a control week. Change window displays weekly or bi-weekly as the Adwave guide suggests
Did redemptions or counts move beyond normal weekly variation?
61-75
Scale or fix
If volume is near the PMax rules of thumb, consider a controlled trial. Otherwise improve the middle of the funnel
Enough conversions to justify a new campaign type?
76-90
Brand and review
Add a brand or reach channel if budget allows. Review the tracker and compare with the baseline
Which two channels stay, and which stop?
Do not change campaign structure in the learning period. The PMax source reports that most poor-result accounts changed structure in weeks two to three. Plan changes for the planned review points.
A weekly one-page review is enough: spend, key counts, the one thing to change next.
Which metrics belong on the tracker?
A tracker must carry at least one measure per stage: visibility, action, visit, revenue and loyalty. Use a fixed weekly day to fill it.
Stage
Metric
Source in practice
Note
Visibility
Profile views, impressions, branded search volume
Profile insights, ad platform, search tools
Branded search is a brand proxy; Adwave (secondary) uses a 30% rise as an example target
Action
Calls, direction requests, bookings, QR scans
Profile, ad platform, call tracking, booking tool
Call quality needs a call log
Visit
Door counts, register transactions, coupon redemptions
Counter, POS
Ground truth for visits
Visit (modelled)
Store visits, footfall uplift, visit rate
Platform or footfall vendor
Eligibility and consent limit coverage
Revenue
Average ticket, revenue per code
POS
Compare with a baseline week
Efficiency
Cost per acquisition, return on ad spend, cost per visit
Fix the definitions before the first week. A "visit" means a register transaction. An "action" means a call, a direction request or a booking. A "conversion" is the one event the ad platform is told to optimise for. Mixed definitions are the most common reason that two reports contradict each other.
Keep a notes column for what changed that week: a price move, weather, an event, a competitor opening. Without it, a rise or fall in counts will be credited to whichever channel was most recently changed.
What this guide cannot tell you
The material behind this guide has gaps, and the most important are listed below.
Store-visit eligibility thresholds are not stated. Only the fact that Google recommends store goals for eligible accounts is available, so eligibility must be checked in the ad account.
Typical conversion rates from profile view to visit, from coupon to redemption or from QR scan to sale are not given. The coffee shop model uses assumptions only.
No independent benchmark of footfall attribution accuracy, panel size or coverage is available. The vendor's description is the only account of how it works.
CTV claims on price and reach come from the vendor. No independent result for a local business is included.
Nielsen and DMEXCO figures are retold by vendors, and the original studies are not available here.
SMS rules, state privacy laws and retention periods are not covered.
The brand-versus-performance splits are recommendations from one vendor, not measured optima.
Forecasts for 2028 e-commerce share are forecasts, and they may be revised.
Local factors such as seasonality, competition and parking vary, and no source quantifies them.
Use the guide as a structure for testing, not as a source of benchmarks. Anything that matters to a decision should be checked with the business's own numbers.
FAQ
What is O2O marketing in simple terms?
It is the use of online channels to move people into a physical business. The Eficaz article (secondary) describes it as attracting customers online and leading them to the store, with in-store-only coupons and local pickup as examples. A visit, a call or a booking is the result, not a click.
Is a Google Business Profile enough for O2O?
It is the base layer, not the whole plan. It is free in the sense described by Eficaz (secondary), and Google's guidelines require a physical location customers can visit, or travel to customers. Ads, email and in-store offers extend it. Profile rules, such as one profile per business and no links in the description, still apply.
Can a small business measure store visits?
Yes, in ways that depend on size. Door counts, register transactions and coupon codes work at any size. Platform store-visit reporting needs eligibility, which the sources say Google recommends only for eligible accounts. Footfall attribution compares exposed customers with a control group, but it needs consent-based device signals and a vendor.
Do TV and streaming ads bring people to a store?
They can raise awareness, but the evidence in the sources is vendor-stated. Adwave (secondary) says clicks from the TV are not the yardstick and that advertisers look for later actions such as website visits, branded search, lead volume or store traffic. Measuring the effect needs a separate visit layer.
How much should a local business spend on O2O?
The sources give a general anchor: small businesses typically allocate 5-10% of revenue to marketing (secondary). They give no O2O-specific budget. Adwave advises starting with 80/20 or 70/30 in favour of performance and keeping 20-30% for brand. The right figure depends on margins and goals.
Should a local business use Performance Max?
Only if the volume and budget fit. One vendor checklist asks whether the business can fund 4 to 6 weeks without cutting budget and reach about 20 to 30 conversions a month, and advises skipping it below about 15 reliable conversions. Those are third-party rules of thumb, not Google rules, so a small controlled test is the safer route.
For help setting up a measurement plan that connects ads, calls and store visits, request a free audit or see the analytics service.
Local marketing strategist with 10+ years at global agencies — OMD, Dentsu, GroupM, and BBDO. Now helping small businesses get the same data-driven edge. Based in Europe, working with clients in the US, UK, Australia, and beyond.